April Credit Snapshot


In April, the credit markets saw a new issue calendar that topped monthly expectations as spreads pushed wider on higher U.S. Treasury rates.
Supply of $107.2 billion narrowly topped the $95 billion projected by dealers. The U.S. Treasury market was steeper by 26 basis points, as rates rose amidst soaring U.S. inflation and the continued war in Ukraine.
Spreads traded in a 20-35 basis point range as the markets continue to be challenged from all directions from volatility. April saw solid secondary activity but was heavily weighted with net client selling of over $9.3 billion, as the new issue calendar saw lighter issuance than March’s record month, and rising rates had investors selling secondary paper.
We continued to see volatility in the markets, with earnings kicking off on April 13 and equities seeing massive swings, geo-political issues with the Russia-Ukraine war, soaring energy prices and daily volatility in U.S. Treasuries which all contributed to a difficult market to navigate for fixed income participants.
|
Issuance Stats |
IG (ex-SSA) Total |
|
MTD |
$107.2 billion |
|
YTD |
$560.5 billion |
|
Supply Run Rate |
|
|
IG Gross (ex-SSA) |
YTD |
|
2022 |
$560.5 billion (+2%) |
|
2021 |
$547 billion |
IG credit spreads were 20 to 40 basis points wider and traded in a wide range for the month (20-35 basis points) closing at the wides. The U.S. Treasury market reversed the flattening trade and steepened with the 2yr note jumping +26 basis points higher, the 10yr +45 basis points higher and the 30yr +52 basis points higher.
Looking at U.S. Treasury rates, we saw the month begin with 2’s — 10’s inverted by 4 basis points and 2’s — 30’s at flat, closing the month with 2’s — 10’s at +15 basis points and 2’s — 30’s at +26 basis points.
The Fed has a tough task ahead this week as they navigate more rate hikes in the middle of the Russia-Ukraine war and soaring inflation on all fronts.
The CDX index began April 2022 at 67.08 on April 1, and steadily traded higher to 84.05 on April 29, to close the month.
The Bloomberg Barclays U.S. Aggregate Average OAS opened April 2022 at 1.15 and traded to the monthly tight of 1.09 on April 5 before steadily moving higher to close at 1.35 on April 29.
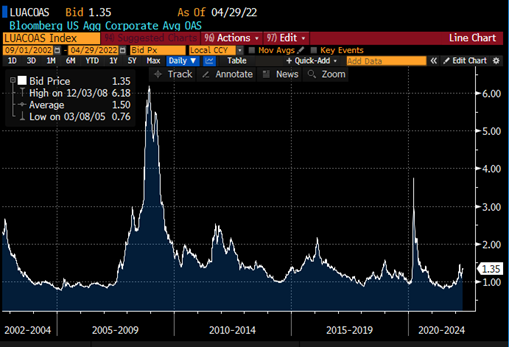
The average high-grade corporate bond spread hit a 16-year low of 0.80 basis points back on June 30, 2021.
See the charts below for more information.
U.S. Treasury Moves
December 31, 2021 – April 29, 2022
|
2yr U.S. Treasury |
10yr U.S. Treasury |
30yr U.S. Treasury |
|||
| December 31 | 0.73% | December 31 | 1.52% | December 31 | 1.90% |
| January 3 | 0.78% | January 3 | 1.63% | January 3 | 2.01% |
| January 18 | 1.06% | January 18 | 1.87% | January 18 | 2.18% |
| January 31 | 1.18% | January 31 | 1.79% | January 31 | 2.11% |
| February 1 | 1.18% | February 1 | 1.81% | February 1 | 2.19% |
| February 15 | 1.58% | February 15 | 2.05% | February 15 | 2.37% |
| February 28 | 1.46% | February 28 | 1.86% | February 28 | 2.19% |
| March 1 | 1.31% | March 1 | 1.72% | March 1 | 2.11% |
| March 15 | 1.85% | March 15 | 2.15% | March 15 | 2.49% |
| March 31 | 2.28% | March 31 | 2.32% | March 31 | 2.44% |
| April 1 | 2.44% | April 1 | 2.40% | April 1 | 2.44% |
| April 14 | 2.47% | April 14 | 2.66% | April 14 | 2.92% |
| April 29 | 2.70% | April 29 | 2.85% | April 29 | 2.96% |
CDX Investment Grade Index
![]()
CDX Investment Grade Index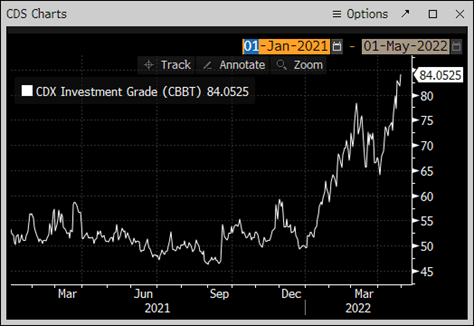
Bloomberg Barclays U.S. Aggregate Corporate Average OAS
January 1, 2021 – April 29, 2022
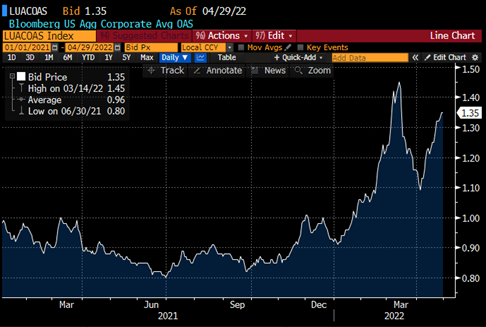
Bloomberg Barclays U.S. Aggregate Corporate Average OAS
September 1, 2002 – April 29, 2022
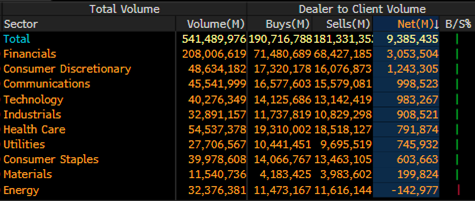
IG credit flows for the month came in at a robust $541 billion vs the trailing months, with March 2022 at $630 billion, February 2022 at $489 billion, January 2022 at $483 billion, the December 2021 low of $372 billion and November 2021 at $439 billion. The trailing six-month average volume is $478 billion.
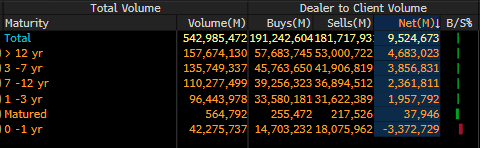
April’s solid new issue calendar along with higher U.S. Treasury rates and net client selling had investors put money to work in the front end of the credit curve, with 0-1yr paper seeing over $3.3 billion of net client buying.
The belly and back end of the credit curve saw net client selling with 12yr and longer paper seeing over $4.6 billion, 3-7yr seeing over $3.8 billion of net client selling, 7-12yr $2.3 billion net client selling and 1-3yr paper seeing $1.9 billion of net client selling.
The financial sector dominated net client selling in April with over $3 billion, followed by consumer discretionary at $1.2 billion, communications at $998 million, technology at $983 million, industrials at $908 million and health care at $791 million.
All sectors in April saw net client selling, except energy, which saw light net client buying of $142 million. See IG Credit Flow charts below for more information.
IG Credit Flows by Sector
April 2022
IG Credit Maturity Flows
April 2022
April saw a new issue calendar that narrowly topped monthly expectations, steepening trade and rising U.S. Treasury rates, heavy secondary trading flows and heavy net client selling as spreads moved significantly wider on the month. The U.S. Treasury curve steepened by 26 basis points as rates moved higher following the previous months flattening trade.
As we look to May and the Fed’s next move, which is expected on Wednesday, Chairman Powell has his work cut out for him, along with the Fed governors, as they navigate inflation. Investors are bracing for the next Federal Reserve interest rate decision which will set the tone for the markets and their appetite for risk.
We were expecting $95 billion of new supply for April and that came in at $107.6 billion. The credit markets have seen heavy secondary trading flows, widening credit spreads, and wide ranges and swings in spreads.
We enter May 2022 with all eyes on Wednesday’s Fed rate decision along with inflation and Russia-Ukraine war. In addition, May is expected to be a heavy deal month with projections coming in at $25 billion for the week and $150 billion for the month.
Great job by the AmeriVet Securities team in April as we were co-manager on $2.5 billion two-part deal for Credit Suisse, co-manager on a $3 billion three-part deal for Keurig Dr Pepper, co-manager on a $12.75 billion seven-part deal for Amazon, senior co-manager on a $6.75 billion three-part deal for Wells Fargo, co-manager on a $2 billion Perpetual for Bank of America and co-manager on a $8.5 billion four-part deal for JP Morgan.
The AmeriVet Securities sales team continues to bring in large volumes of differentiated orders from Tier II and Tier III accounts on new issue deals.