December Credit Snapshot


In December, the credit markets saw a record-setting new issue calendar that topped expectations. Spreads were 5 to 25 basis points tighter to close out the year, as massive month-end buying fueled a spread rally.
The U.S. Treasury market was flatter by 8 basis points as U.S. Treasury rates rose, amidst rising cases of the omicron variant that lead to a flattening trade into month-end.
Spreads traded in a 5-20 basis point range in December as credit saw less volatility and rallied into month end. The solid new issue calendar beat estimates of $55 billion closing the month at $61.7 billion, the largest December on record, and the second largest annual gross volume figure ($1.41 trillion in 2021 vs $1.75 trillion in 2020).
Secondary activity in December saw $12.4 billion of net client buying to close out the year, as investors scrambled to buy paper across the curve with continued heavy buying of front-end maturities as rising rates have put investors on notice and they have bought everything they can of shorter dated maturities.
December saw a little less volatility in the markets, but the omicron variant saw spiking numbers across the country. In addition, we are still dealing with supply chain issues, spiking energy prices and inflation fears. Investors have been presented with a difficult market to invest in, as we closed out the fourth quarter of 2021 and look to a new beginning in January 2022.
| Issuance Stats | IG (ex-SSA) Total |
| MTD | $61.7 billion |
| YTD | $1,410.7 billion |
| Supply Run Rate | |
| IG Gross (ex-SSA) | YTD |
| 2021 | $1,410.7 billion |
| 2020 | $1,748 billion (-19%) |
| 2019 | $1,108.2 billion (+27%) |
IG Credit spreads for December were 5 to 25 basis points tighter and traded in a wide range for the month.
The U.S. Treasury market has investors weighing where to put money to work on the credit curve. The U.S. Treasury market saw a continued flattening trade on the month with the 2yr +17 basis points higher, the 10yr +9 basis points higher and the 30yr just +8 basis points higher.
When looking at the U.S. Treasury rates year-over-year, we saw the 2yr jump +60 basis points, 10yr +59 basis points and the 30yr +25 basis points. This is a stark contrast to the opening levels of 2021 last January, when the 2yr traded 0.13%, 10yr 0.93% and the 30yr 1.65%.
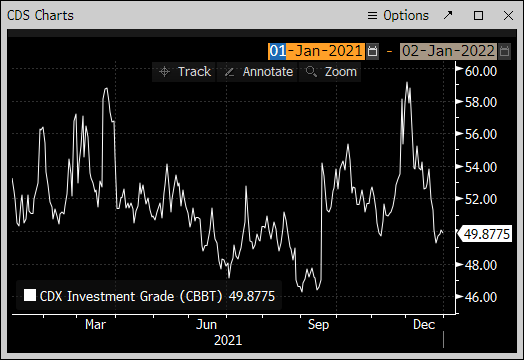
The CDX Investment Grade Index opened December at 59.135 and steadily traded lower, before hitting the months low of 49.29 on December 27, and then closed the month at 49.506 as the spread rally fueled lower levels on the CDX index.
In 2021, the CDX index began 2021 at 53.255 on January 4, and saw a high of 59.135 on December 1, with a low of the year September 1, at 46.3.
The Bloomberg Barclays U.S. Aggregate Average OAS opened December at 1.01 and steadily traded lower for the first week to .95 on December 7, followed by a slight spike to 1.00 on December 20, before trading steadily lower into month-end, closing at .92
In addition, 2021 saw quite a bit of volatility in the index, as we began the year at .98 on January 4, with a high of 1.01 on December 1, a low of 0.80 June 30, with an average of 0.89 for the year.
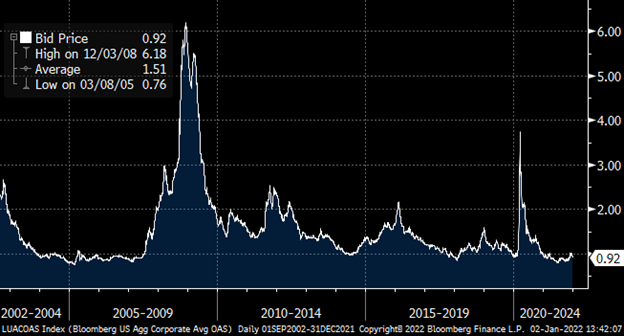
The average high-grade corporate bond spread hit a 16-year low of 0.80 basis points back on June 30, closing the month of June.
See the charts below for more information.
Treasury Moves
January 4, 2021 – December 31, 2021
| 2yr U.S. Treasury | 10yr U.S. Treasury | 30yr U.S. Treasury | |||
| January 4 | 0.13 % | January 4 | 0.93% | January 4 | 1.65% |
| March 31 | 0.16% | March 31 | 1.74% | March 31 | 2.41% |
| June 30 | 0.25% | June 30 | 1.45% | June 30 | 2.06% |
| September 30 | 0.28% | September 30 | 1.52% | September 30 | 2.08% |
| December 1 | 0.56% | December 1 | 1.43% | December 1 | 1.82% |
| December 15 | 0.69% | December 15 | 1.47% | December 15 | 1.85% |
| December 31 | 0.73% | December 31 | 1.52% | December 31 | 1.90% |
CDX Investment Grade Index

CDX Investment Grade Index
Bloomberg Barclays U.S. Aggregate Corporate Average OAS
January 1, 2021 – December 31, 2021
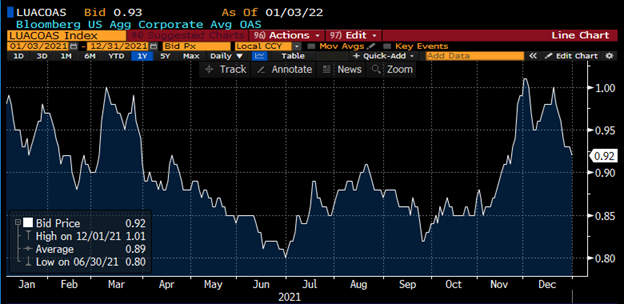
Bloomberg Barclays U.S. Aggregate Corporate Avg OAS
September 1, 2002 – December 31, 2021
IG credit flows for December were the lightest of 2021 and came in at $372 billion. This is compared to $439 billion in November, $458 billion in October, $464 billion in September, $390 billion in August, $428 billion in July, $515 billion in June, $453 billion in May, $499 billion in April, $641 billion in March, $512 billion in February and $525 billion in January. The trailing six-month average volume is $425 billion.
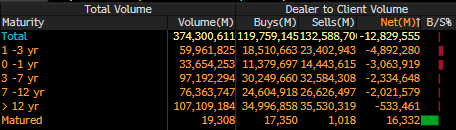
December’s strong new issue calendar saw portfolio managers continue to buy the new issue calendar. We saw massive month-end and year-end buying of secondary paper across all sectors and all maturities, coming in at $12.4 billion.
In December, investors put the lion’s share of their money to work in the front end and belly of the curve, with 0-3yr paper seeing $7.9 billion of net client buying and 3-7yr paper seeing $2.3 billion in net client buying.
We saw massive net client buying into year-end, with a topline number of $12.4 billion of net client buying.
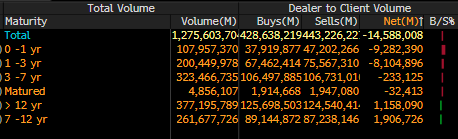
Looking at the trailing three months, the front end of the market has seen massive buying, with 0-1yr paper seeing $9.2 billion in net client buying and 1-3yr paper seeing $8.1 billion in net client buying.
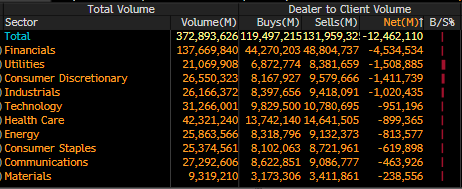
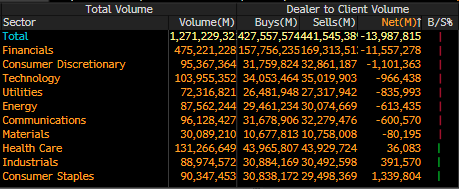
The financial sector dominated net client buying with the trailing three months seeing $11.5 billion while the overall market saw $13.9 billion of net client buying.
In the trailing three months, investors favored the financial sector with $11.5 billion in net client buying along with consumer discretionary ($1.1 billion), technology ($966 million), utilities ($835 million), energy ($613 million), communications ($600 million) and materials ($80 million).
Health care, industrials and consumer staples all saw net client selling.
See IG Credit Flow charts below for more information.
IG Credit Flows
December 2021
IG Credit Maturity Flows
December 2021
Trailing Three Months by Sector
October 1, 2021 – December 31, 2021
Trailing Three Months by Maturity
October 1, 2021 – December 31, 2021
December saw a new issue calendar that topped monthly expectations, super light secondary trading flows, massive net client buying into month-end and year-end, which caused solid spread tightening.
The U.S. Treasury curve saw a flattening yield curve and spike higher in rates. The credit markets saw a bit of a change in the credit curve this month with net client buying across all maturities that was heavily weighted in the front end and belly of the curve.
We are expecting $125 to 145 billion of new supply in January 2022, which is in line with typical totals to begin the year, as January 2021 saw $127 billion come to market.
The credit markets are beginning the month with spreads trading firm and projections for the week are calling for $40 billion in new supply. The first week back in January is traditionally busy — January 2021 saw over $49 billion sold.
2022 will be challenging, with a Federal Reserve that has signaled it will be less accommodative in a rising rate environment and tapering its asset purchases. The Federal Reserve will continue to have a difficult task to try and navigate supply chain issues, worker shortages, energy prices, geopolitical strains, rising U.S. Treasury rates, mid-term elections, and “COVID fatigue,” as the world enters year three of the coronavirus pandemic.
There are plenty of headwinds as we begin the new year. The primary and secondary credit markets will take their cue and react to all of these issues that are influencing the market.
New issue projections for 2022 are calling for $1.1 trillion to $1.7 trillion, with an average of $1.35 trillion just below 2021’s record year-end.
Great job by the AmeriVet Securities team in December, as we were co-managers on an $8 billion five-part deal for Merck, $1 billion deal for Goldman Sachs Group, $2 billion two-part deal for Bank of America, $750 million deal for KKR Group Financial, Inc., and a $500 million deal for Brighthouse Financial Global Funding.
The AmeriVet Securities sales team continued to bring in large volumes of differentiated orders from Tier II and Tier III accounts on new issue deals throughout 2021, on joint lead managed deals and co-managed deals.
AmeriVet Securities made great strides in 2021, as we more than doubled 2020’s 36-deal count and two $25 par preferred, with 87 deals and five $25 par preferred in 2021, as highlighted by our March 2021 role as a co-manager on the benchmark $25 billion nine-part Verizon deal.