February Credit Snapshot

In February, credit markets experienced a feeble new issue calendar that fell short of
expectations as spreads were 15 to 35 basis points wider than anticipated. The U.S.
Treasury market was flatter by 21 basis points after rates rallied amid Russia’s invasion
of Ukraine. Throughout February, spreads traded at a 25 to 50 basis point range as the
markets remained challenged by volatility from every direction.
The new issue calendar estimate of $90-100 billion was not realized as the month closed
at $81.35 billion. Secondary activity in February brought over $359 million of net client
buying on the back up in spreads, as investors bought secondary paper at the month
wides amidst market turmoil.
Similar to January, volatility remained prevalent in the equity and Treasury markets
during February. The geo-political factors encompassing Russia and Ukraine affixed with
spiking energy prices and frequent volatility in the U.S. Treasury rate market produced a
difficult environment for traders, investors, and issuers to navigate.
| Issuance Stats | IG (ex-SSA) Total |
| MTD | $81.35 billion |
| YTD | $223.44 billion |
| Supply Run Rate | |
| IG Gross (ex-SSA) | YTD |
| 2022 | $223.44 billion (+11%) |
| 2021 | $220.1 billion |
IG credit spreads were 15 to 35 basis points wider and traded within a wide range during
February. The U.S. Treasury market continued to experience a flattening trade with the
2-year note +28 basis points higher, the 10-year note +5 basis points higher, and the 30-
year note +7 basis points higher.
Looking at U.S. Treasury rates, we saw the month begin with 2’s — 10’s, at 63 basis
points and 2’s — 30’s at 94 basis points, but as Russia began invading Ukraine, we
closed the month with 2’s — 10’s at +40 basis points, and 2’s — 30’s closed at +73 basis
points. We saw a massive rate rally to close the month as investors flocked to the flight
to quality trade. The Fed has a lot on their plate for their March meeting and potential
rates increases could come amide Russia’s invasion of Ukraine.
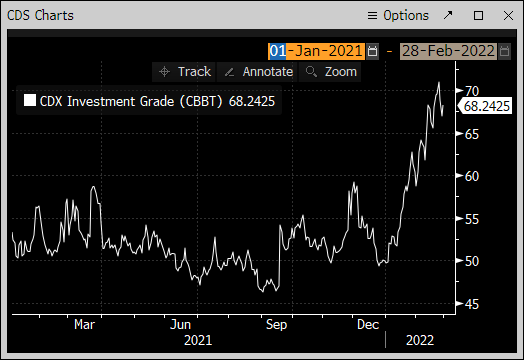
The February CDX index began at 58.66 on 2/01/22 and steadily traded higher reaching
the monthly high of 70.935 on 2/23/22, before closing the month at 68.24. (Charts
Below)
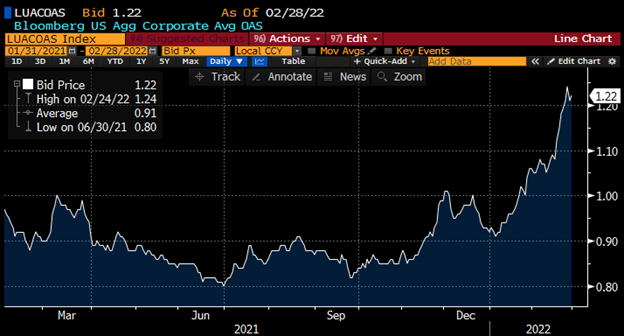
The Bloomberg Barclays US Agg Avg Oas opened 2/01/22 at 1.05 and steadily traded to
the monthly high of 1.24 on 2/24/22 before closing the month at 1.22 on 2/28/22. (Charts
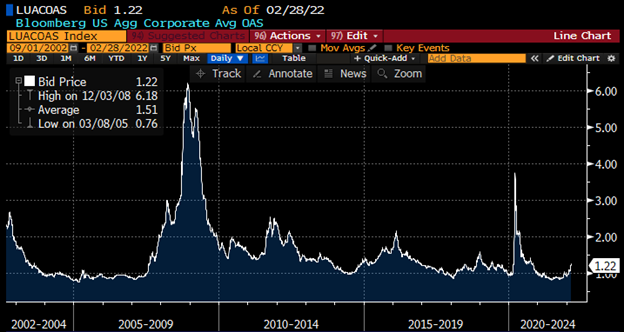
Below) The average high-grade corporate bond spread hit a 16-year low of 0.80 basis
points back on 6/30/21 to close out the month of June.
See the charts below for more information.
U.S. Treasury Moves
December 31, 2021 – January 31, 2022
| 2yr U.S. Treasury | 10yr U.S. Treasury | 30yr U.S. Treasury | |||
| December 31 | 0.73% | December 31 | 1.52% | December 31 | 1.90% |
| January 3 | 0.78% | January 3 | 1.63% | January 3 | 2.01% |
| January 18 | 1.06% | January 18 | 1.87% | January 18 | 2.18% |
| January 31 | 1.18% | January 31 | 1.79% | January 31 | 2.11% |
| February 01 | 1.18% | February 01 | 1.81% | February 01 | 2.19% |
| February 15 | 1.58% | February 15 | 2.05% | February 15 | 2.37% |
| February 28 | 1.46% | February 28 | 1.86% | February 28 | 2.19% |
CDX Investment Grade Index
![]()
CDX Investment Grade Index
Bloomberg Barclays U.S. Aggregate Corporate Average OAS
January 31, 2021 – February 28, 2022
Bloomberg Barclays U.S. Aggregate Corporate Average OAS
September 1, 2002 – February 28, 2022
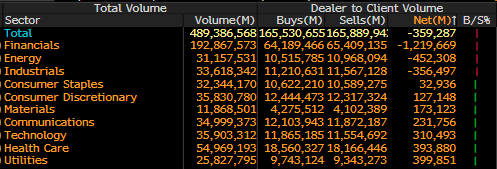
IG credit flows for the month of February came in at $489 billion vs trailing 6 months: January -$483 billion, December-low of $372 billion, November-$439 billion, October-$458 billion, September-$464 billion. The trailing 6-month average volume is $450 billion.
A reduced new issue calendar along with higher rates had investors putting money to work in the front end of the credit curve with 0-to-1 year paper seeing over $2 billion of net client buying and 3 to 7-year paper seeing over $1.4 billion of net client buying together accounting for over $3.4 billion in net client buying.
The back end of the credit curve saw net client selling with 7 to 12-year paper seeing over $2.2 billion and 12-year and longer paper seeing over $841 million of net client selling.
Throughout February, the Financial sector dominated net client buying with over $1.2 billion, while Energy saw $452 million, and Industrials saw $356 million. The remaining sectors are seeing net client selling. (See IG Credit Flow charts below)
See the IG Credit Flow charts below for more information.
IG Credit Flows
February 2022
IG Credit Maturity Flows
February 2022

During February, we saw a new issue calendar fall shy of monthly expectations, continued volatility in U.S. Treasury rates, and solid secondary trading flows with light net client buying on the heels of wider spreads and global tensions.
The U.S. Treasury curve flattened 21 basis points with the month end rally being overshadowed by geo-political matters. The Fed raising rates in February was also dwarfed by Russia’s invasion of Ukraine. The credit markets will take their cues from the developing Russia/Ukraine situation and upcoming Fed meeting as investors decide where on the curve to invest and deploy cash.
We were expecting $90-100 billion of new supply for February but came in at $81.35 billion. The credit markets, despite all the volatility and spread widening, have traded in a very orderly fashion without any major panic, but how long this will last is unknown. As we enter March 2022, all eyes will be on the developing Russia/Ukraine situation, and we will see how the Fed will react during their March meeting.
“Covid Fatigue” has taken a back-seat as many states are dropping mask mandates and omicron numbers are plummeting. The lone positive amongst all the volatility has been the recent drop in U.S. Treasury yields which has created an opportunity for issuers to come to market after a few weeks of Go/No-Go calls that have delayed deals amid volatility as syndicate desk strive to provide best execution for issuers.
Excellent job by the AmeriVet Securities team in February as we were a Senior Co-Manager on $3.5 billion, 11 NC10 for Well Fargo, JT-Lead manager on $750 million FRN for Morgan Stanley, Co-Managers on $1.75 billion 4NC3 for Morgan Stanley, $450 million PerpNC5 $25 Par PFD for U.S. Bancorp, $500 million News Corp 10-year, $1.5 billion 3-part deal for Enbridge and Co-Manager on $6 billion 4-part deal for Bristol Myers.
The AmeriVet Securities sales team continues to bring in large volumes of differentiated orders from Tier II & Tier III accounts on new issue deals.


