Is It Time for the Yield Curve to Finally Steepen?


Since bottoming in August of 2019, with the extreme grab in outright yield and duration, the US yield curve has been grinding its way steeper. With the weakness in the global economy showing signs of spillover into the US economy last month, coupled with the Fed’s recent decision to expand its balance sheet with the purchase of T-bills while still easing, the dynamics for further steeping of the yield curve may finally be in place.
US Yield Curve Inversion & Negative Global Rates
The US yield curve is being distorted by global forces. Although not entirely. Much of the discussion around the inversion of the US Treasury curve involves implications for recession. This most recent move lower in outright yield (2/10 inversion) from this past August, however, along with continued weakening of the global economy, signals a perception now the Fed may be behind the ‘curve’. Still, it is undeniable that a portion of the duration grab on the longer end of the UST curve is being influenced by the growing pool of negative sovereign bonds abroad and the quest for high quality assets with increased uncertainty around the outlook for the US economy.
Chart on Negative Yielding Global Assets: Peak in August 2019
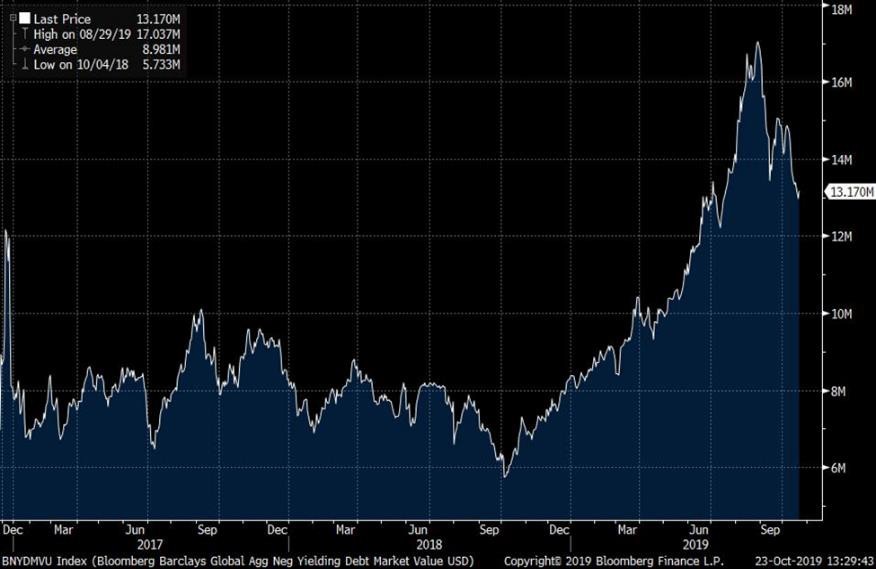
Chart on the US 2/10 Yield Curve with Peak of Inversion Correlated to Peak in Negative Yields from August
Doesn’t the Yield Curve Steepen When the Fed Eases?
The short answer is, generally yes. As economic activity slows toward the end of a business cycle, longer end rates typically begin to anticipate the slowdown, preceding actual central bank action. So, in general there is often discussion around inverted yield curves and whether they indicate recession. History tells us inverted curves generally are signaling trouble ahead. Back in August of this year, the debate around the yield curve was at its pinnacle with the US economy holding up and simultaneously curves inverting. Recession or not?
As the above charts show, however, there was clearly spillover from the negative yield story as buyers came to the US markets looking for yield in both sovereign and credit debt. In fact, US credit spreads are still tight, and our trading desk continues to see demand for yield even with the inordinate amount of investment grade issuance in September. “September was a record month for new issues with Investment Grade Supply successfully pricing just over 158bln making it the third-largest month by gross on record. In addition to the massive demand for New Issues, we have seen a wall of cash from the buyside the last 3 months and that has resulted in over 12 billion in net client buying of secondary paper” said Stephen Haas, Head of Investment Grade Credit Trading, AmeriVet Securities.
Curve Behavior Ahead of Central Bank Action
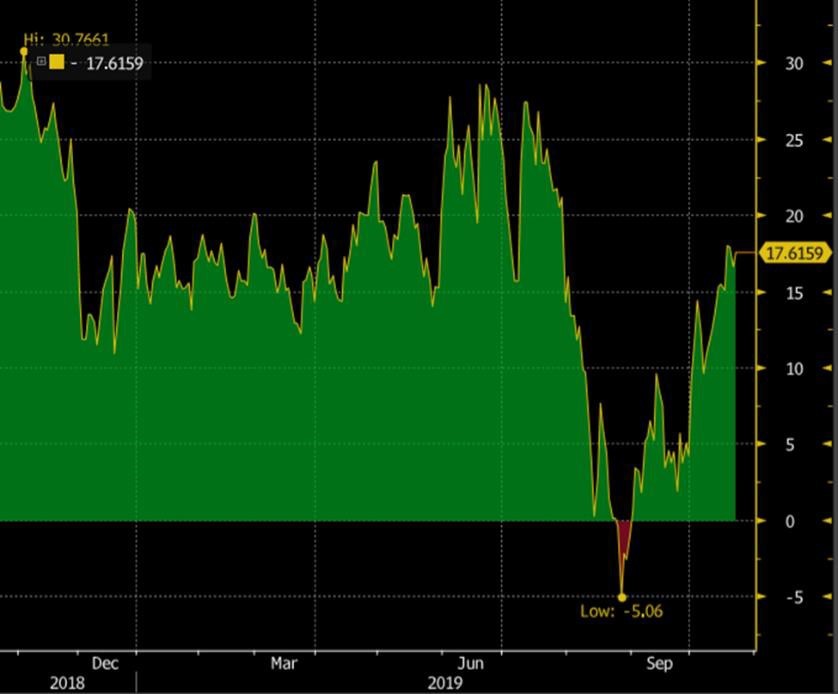
We highlight the chart below when looking at the global slowdown story and the inverted yield curve narrative: it is the 2/5 Treasury curve. As we indicated above, typically certain parts of the curve begin to richen as the economy slows. In the case below, as the global trade war accelerated this year and rates began their descent, the belly of the US curve reaped the reward of flows as cash found a home, lending itself to the 2/5 curve trading inverted for the better part of 2019. As can be seen from the chart below, this past August provided an inflection point, and we’ve been slowing trying to steepen ever since and even trade positive lately.
Why is the Curve Not Steepening Like Prior Easing Cycles?
We believe the answer here is twofold: both the influence of buying on the longer end of the yield curve as investors look for positive yield in the US, coupled with the Federal Reserve and the notion of a mid-cycle adjustment versus a full easing cycle.
When the Federal Reserve first began its easing campaign this past July, Chairman Powell in his press conference referred to the Fed’s campaign to begin easing rates as a “mid-cycle adjustment”. In other words, within the Fed’s commitment to normalize the Fed Funds Rate from the Zero Lower Bound (ZLB), the path toward higher rates may not be a straight line; adjustments may be necessary.
In the Fall of 2018, the Fed Funds Rate was on course to peak at around 3%. Dating back to one year ago this month, the Fed was intimating 3 more interest rate hikes before they made their dramatic ‘Pivot’ at the beginning of 2019. As the trade war intensified, and the Fed made its Pivot, the markets quickly reversed with long end US rates ultimately declining by roughly 200-basis points. So, the move from the Fall of 2018 until the first easing in July 2019, was very dramatic in the Fed’s mind. As such, and uncertain about how to handle the global trade dynamic within the context of monetary policy, the notion of the current easing campaign just being a ‘tweak’ along a continued course of more tightening became embedded in the pricing of Fed expectations: slow, steady and with a divided committee.
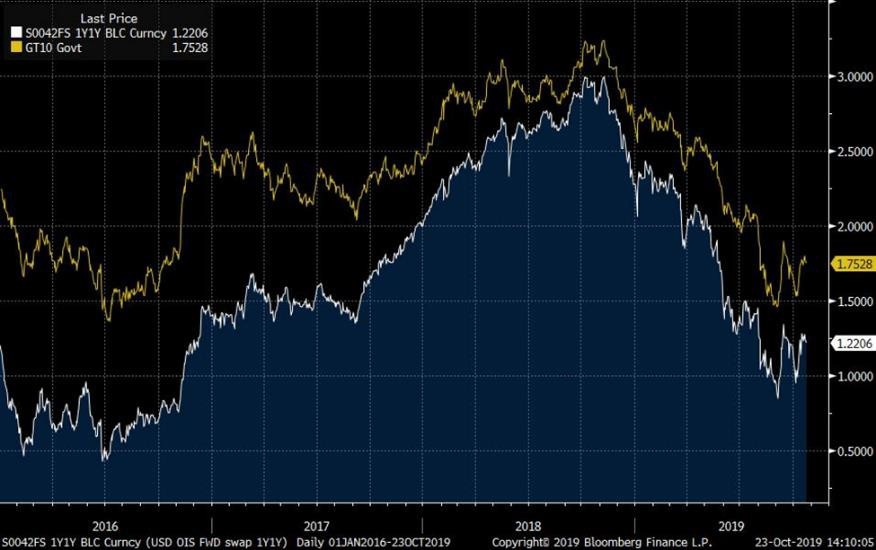
The USD OIS Curve Versus 10-Year Yields Peak in the Fall of 2019 & Trade Lockstep 2019
The Pace of the Fed Easing is Slow & Reluctant
When looking at many prior easing cycles, the conviction of the Federal Reserve is generally high once they decide to move. If you go back in history, most of the full easing cycles began with moves of 50-basis points to start. With this cycle, however, the Fed has referenced other period of slight adjustments though: 1995 and 1998.
Since the beginning of this easing campaign, Chairman Powell has dealt with the backlash of traditional economists, in addition to certain Fed committee members that didn’t see the need for lower rates. The notion that, although the global economy has weakened, the US consumer which in and of itself is the second largest economy in the world, remains in good shape. Additionally, what place does the Fed have in playing a role in fighting a trade war? A consistent question within and outside the walls of the Fed.
In the end, this has lent itself to a very measured approach from the Fed, as Chairman Powell balances controlling the committee by both appeasing the doves and hawks. When you couple this with the spillover of the negative yield-global slowdown story, the Fed easing has been outpaced by the buying needs on the longer end of the US curve. In the end, the real driver of global rates this year has come from outside the US market.
Repo Dynamics, Balance Sheet Expansion & Slowing US Data
Repo Dynamics & Fed Balance Sheet
Most market participants are aware of the Repo distortions in mid-September. The ensuing days have since inspired discussions at all levels of finance and government with many explanations and theories as to what’s driving the recent outsized events. This is not a Repo discussion, but one of the main outcomes of the mid-September spike in funding involved the Fed and its post-GFC ample reserve framework.
Within this framework, the premise of controlling the Effective Funds Rate begins with the Banks having what the Fed considers “ample reserve”. And in conjunction with this ensuring the EFF rate stays within a certain band by paying banks Interest on the Excess Reserves (IOER) and further using a RRP facility for insurance.
Over the course of 2019, the confluence of two events (both on the liability side of the Fed’s balance sheet) created a dynamic whereas aggregate reserve levels became too scarce: unwinding of assets from the GFC QE program and the increase in Currency in Circulation.
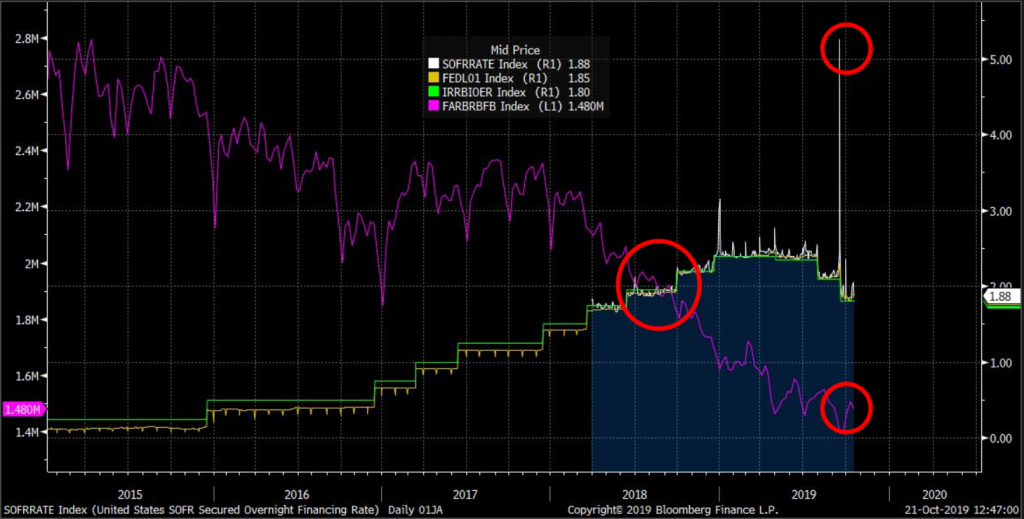
Chart Below: SOFR, EFF, Rate on Excess Reserves & the Declining Reserve Balances
The Fed Expands Balance Sheet with Purchasing the Short End: T-Bills
On October 11th, and to separate this month’s policy decision on the 30th from the funding issues, the New York Fed announced its ambition to begin a permanent increase in bank reserves through the purchase of T-bills.
Statement Regarding Treasury Bill Purchases & Repurchase Operations from the New York Fed
“In light of recent and expected increases in the Federal Reserve’s non-reserve liabilities, the Federal Open Market Committee (FOMC) directed the Desk, effective October 15, 2019, to purchase Treasury bills at least into the second quarter of next year to maintain over time ample reserve balances at or above the level that prevailed in early September 2019. The Committee also directed the Desk to conduct term and overnight repurchase agreement operations (repos) at least through January of next year to ensure that the supply of reserves remains ample even during periods of sharp increases in non- reserve liabilities, and to mitigate the risk of money market pressures that could adversely affect policy implementation.”
There has been much debate over whether the purchases were like those we saw coming out of the GFC, and the Fed was quick to defend the purchases as “technical”. Certainly, open to debate in our view is that the purchases are not intended as QE, and thus the reason the Fed is keeping the purchases at the very short end of the curve. Nonetheless, the reserve balances were one of several reasons given for the funding distortions. Many have also pointed to several regulatory burdens put in place on the larger banks over the last 5-10 years which are restricting the use of cash. These explanations all seem to carry merit in our view.
From a yield curve perspective, the Fed is not only lowering the absolute level of funding, they are now conducting short end purchases as well. And when looking at the recent statement from NY Fed President Williams, there appears to be a reluctance to tweak the regulatory calculations. From Williams’ speech a little over a week ago:
“Williams said the central bank’s moves to boost the level of reserves through the increase of its $3.6 trillion portfolio would take into account such “unintended consequences” regardless, and that the capital requirements were “there for a reason”, citing the soundness of the biggest U.S. banks.”
So, the point here, is when looking at Williams’ comments on reserves versus the regulations, should changes not come on the regulatory front, the emphasis on the aggregate reserve levels may very well play a greater role going forward and lend itself to more short end buying over time, not less.
Weakening Data: Is the Fed Behind the Curve?
Within most of the discussion in 2019 and amidst the global slowdown, has been the narrative of the “strength of the US consumer”. Essentially, the global slowdown story is not a problem for the US until it is. And this has been the crux of the debate within the Fed as well, as some of the committee members have not seen the need for the Fed to provide official rate liquidity.
A string of weak data last month, however, when both the manufacturing and non-manufacturing numbers came in weak, had many market participants once again questioning whether the Fed was behind the curve. Additionally, the most recent earnings announcement coming out of the US have been clearly showing signs of spillover from the global growth slowdown, and in many cases forward guidance coming down into 2020.
Is the Fed Still Too Tight?
Beginning in the 2nd quarter of 2019, we began to vocalize we thought the Fed Funds rate was too high and by 50-100 basis points. The Fed, themselves, repeatedly has expressed the notion of moving faster not slower when buffering up against zero interest rates. Let’s face it, the Fed only has so much room to go before unconventional measures come into play.
Yet, despite expressing this view, the Fed has been very slow and reluctant to react while the global forces of the trade war, Brexit and various other geopolitical dynamics globally continue to eat away at business confidence.
Case & point, the CFO of Caterpillar said on their earnings call the morning:
“When there is global uncertainty in economic outlook, they defer making decisions” from Caterpillar’s CFO.
This certainly makes sense to us. Incoming ECB President Christine Lagarde expressed similar views on CBS’ 60 Minutes this past Sunday with regards to global trade. Business leaders and companies can adapt to changes so long as they are known. For years now, the global economy has been dealing with too many unknowns.
Then we turn to the US consumer. For months now listening to chatter about negative interest rates, inverted yield curve and talk of recession. The US consumer has done great, and certainly has the underpinnings of extremely low longer-term rates, but in no way shape or form immune to the global forces at hand.
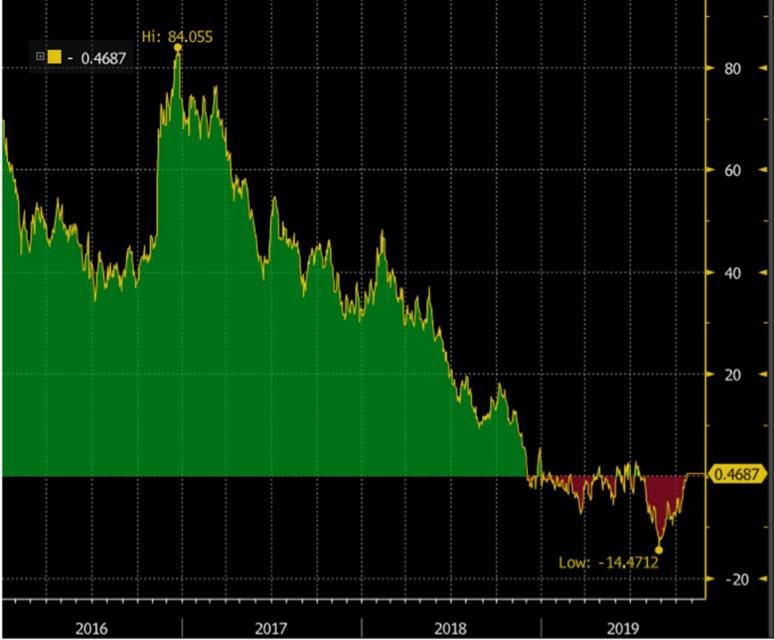
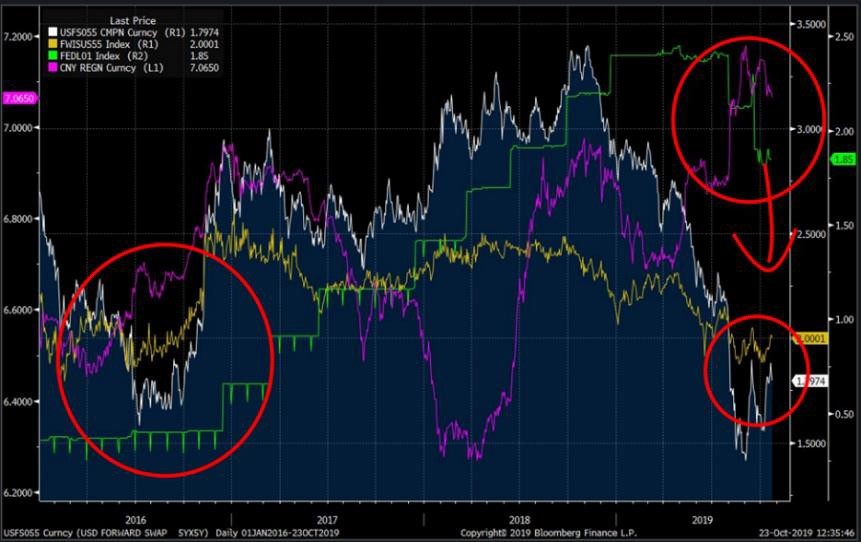
The chart below takes us back to 2016, a period that looks like now in many ways. It includes the Chinese Yuan, 5-year forward, 5-year outright swap rates and inflation breakeven and the Effective Fed Funds rate.
The Funds Rate still sits as an outlier. As foreign central banks around the world, the People’s Bank of China included, continue to provide more and more liquidity, the US Fed has continued to take a very methodical and reluctant approach. In the end, the US consumer is the greatest risk for the Fed. And right now, with signs of the US economy feeling the global slowdown, The Fed should be thinking about more, not less liquidity, and creating some shape to the US yield curve.
With the Fed Meeting Approaching What are the Potential Scenarios for the Yield Curve?
- Range Bound: when looking at the 2/10 UST curve, from the steepest levels around +27- basis points after the first Fed rate cut in July through the August lows inverted by over 5- basis points, the curve could very well remain in that range as the broader economic issues play out and the Fed signals to play it meeting to meeting. Longer term, it would be the data which would guide the curve as we head into the latter part of 2019 into 2020. This would likely lend itself to volatility within the current range.
- Breakout Steeper: we have reached a point of potential outcomes on some of the major themes of the last several years, namely Brexit and the Trade War. Clearly, outcomes remain uncertain as we write. However, should we see some concrete outcomes and the clearing of ‘some’ of the air on the major global uncertainties in conjunction with central banks still providing insurance liquidity, we could very well begin to see the curve steepen out further.
- Retest Inversion: The Fed speak from the September has been mixed. Ironically, at a time when signs of real weakness in the US data emerges. Although we are priced for the Fed to ease again next week and it’s the likely outcome, the potential for the Fed to push back on the market exists.
Keep in mind, the major global forces at hand have already caused damage to the real economy. So better clarity going forward doesn’t necessarily mean central bank liquidity will turn off at the swipe of a pen. Additionally, should the spillover at this point further show itself in the US data, the Fed may very well be forced to ease more, not less, despite progress on the headwinds of 2019. Seems counterintuitive but plausible, as a lag could very well exist at this point between the global turbulence, timing of spillover into the US and the Fed’s planned game plan.
Our core theme from the outset of 2019 has been “Fed Intentions versus Market Expectations. And although we believe the Fed will ease again next week, we do feel when listening to the dialogue amongst committee members, the bar is higher at this moment for future cuts. With the yield curve already priced close to 100% for a cut next week, and year end risks remaining, a hawkish cut from the Fed could very well lead to dynamics of sharp flattening from here as the data and year plays out and the Fed’s future intentions questioned.