January Credit Snapshot

The credit markets in January saw a new issue calendar that topped monthly expectations and we saw tighter spreads along with lower U.S. Treasury rates to begin the new year. The new issue calendar came in at $143.85Bln beating expectations of $130Bln. The U.S. Treasury market saw 2’s—10’s close inverted by 69 basis points and 2’s-30’s inverted by 56 basis points at month end. Spreads were 20-40 basis points tighter and traded in a 20-40 basis point range on the month. January saw heavy secondary trading activity and over $6.9Bln in net client selling with spreads moving tighter and yields on U.S. Treasury rates lower.
We saw a strong trend late in 2022, as November marked the fifth straight month of net client selling (7/01/22—11/30/22 $39.8Bln net client selling), but December reversed that trend. Volatility in January was much lighter than previous months and while we did not have a Fed meeting last month, we will see the Fed on February 1, with a potential 25-basis point rate hike.
| Issuance Stats | IG (ex-SSA) Total |
| MTD | $143.85Bln |
| YTD | $143.85Bln |
| Supply Run Rate | |
| IG Gross (ex-SSA) | YTD |
| 2023 | $143.85Bln |
| 2022 | $142.09Bln |
| 2021 | $127.5Bln |
IG credit spreads were 20-40 basis points tighter and traded in a wide range for the month (20-40 basis points). The U.S. Treasury market saw 2yr notes lower by -19 basis points, 10yr notes lower by -27 basis points and the 30yr closing the month lower by -23 basis points.
Looking at U.S. Treasury rates in January we saw the month begin with 2’s — 10’s inverted by 61 basis points and 2’s — 30’s by 52 basis points, closing the month with 2’s — 10’s inverted by 69 basis points and 2’s — 30’s inverted by 56 basis points. It is hard to believe that we closed the month of January 2022 with 2yr notes trading at 1.18%, 10yr notes 1.79% and 30yr bonds 2.11% with rates now +303 basis points higher on 2’s, 173 basis points higher on 10’s and 154 basis points higher on 30yr’s, respectively.
The Fed last raised rates on 12/14/22 50 basis points. We expect the Fed will use smaller rate hikes to try and create a soft landing as to try and avoid a full-blown recession and reach the target of 5.25%.
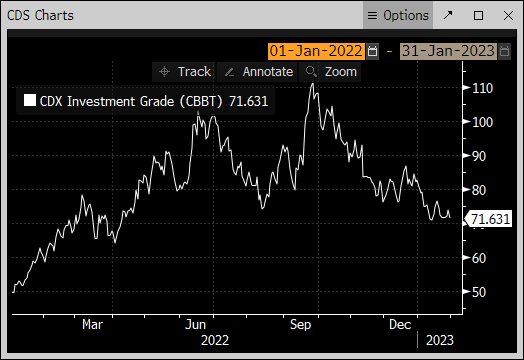
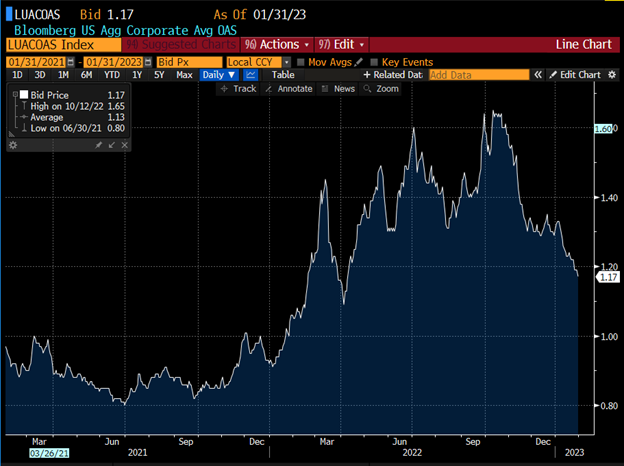
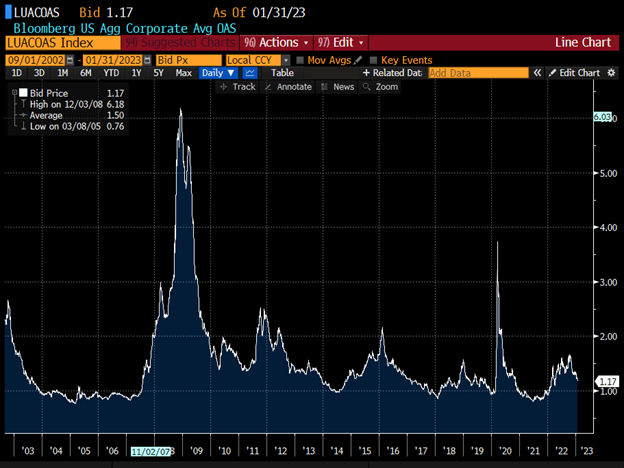
The CDX index started January 2023 at 80.67 and traded consistently lower into 1/13/23 at the month low of 70.8 before closing the month at 71.63 on 1/31/23. The Bloomberg Barclays U.S. Aggregate Average OAS opened January 2023 at 1.32 and traded steadily lower into month end before closing at 1.17 on 1/31/23 the tightest level since April 2022.
See charts below for more information.
U.S. Treasury Moves
12/31/21 to 1/31/23
| 2yr U.S. Treasury | 10yr U.S. Treasury | 30yr U.S. Treasury | |||
| 1/31/22 | 1.18% | 1/31/22 | 1.79% | 1/31/22 | 2.11% |
| 12/01/22 | 4.25% | 12/01/22 | 3.53% | 12/01/22 | 3.64% |
| 12/15/22 | 4.23% | 12/15/22 | 3.44% | 12/15/22 | 3.48% |
| 12/30/22 | 4.41% | 12/30/22 | 3.88% | 12/30/22 | 3.97% |
| 1/03/23 | 4.40% | 1/03/23 | 3.79% | 1/03/23 | 3.88% |
| 1/17/23 | 4.18% | 1/17/23 | 3.53% | 1/17/23 | 3.64% |
| 1/31/23 | 4.21% | 1/31/23 | 3.52% | 1/31/23 | 3.65% |
CDX Investment Grade Index January 2023

CDX Investment Grade Index January 2023
Bloomberg US Agg Corporate Avg OAS 01/01/21—1/31/23
Bloomberg Barclays US Agg Corporate Avg OAS 09/01/02—1/31/23
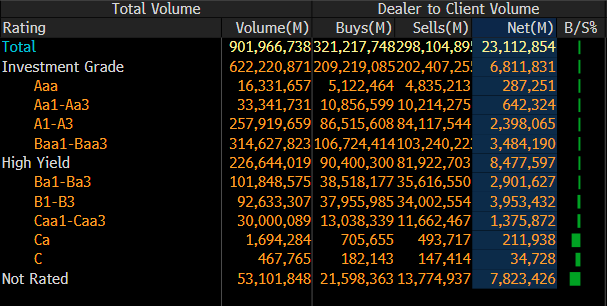
IG credit flows in January came in at a robust $620Bln vs trailing months in 2022: December $467Bln, November $566Bln, October $574Bln, September $576Bln and August $536Bln. The trailing six-month average volume is $556Bln.
January saw a heavy new issue calendar that topped expectations and much tighter spreads along with solid net client selling on solid volume. January saw $6.9Bln in net client selling. The 3-7yr, 1-3yr, 12-30yr and 7-12yr part of the credit curve saw net client selling with 3-7yr and 1-3yr seeing the bulk of selling ($6.1Bln) with 0-1yr paper seeing over $941mm in net client buying.
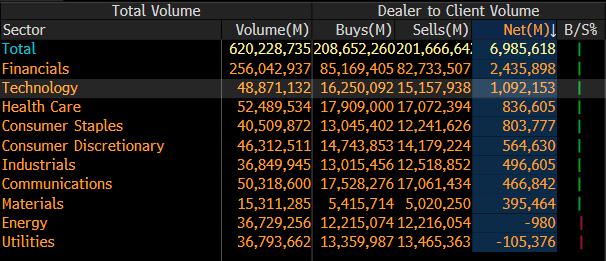
Almost all sectors saw net client selling with financials seeing $2.4Bln and technology $1Bln seeing the bulk of selling, while utilities and energy saw net client buying. Looking at the markets from a ratings perspective, Baa1/Baa3 paper saw the lion’s share of selling with $3.4Bln, A1/A3 paper seeing $2.3Bln, Aa1/Aa3 paper seeing $642mm and Aaa paper $287mm.
See IG credit flow charts below.
January 2023 IG Credit Flows by Sector
January 2023 IG Credit Maturity Flows

January 2023 IG Credit by Investment Grade Ratings
January’s new issue calendar topped monthly expectations, while the U.S. Treasury curve saw rates move lower and a curve that further inverted with absolute yields lower. We saw heavy secondary trading flows for the month that lead to net client selling, as spreads were significantly tighter. The U.S. Treasury curve saw 2’s 10’s close inverted by 69 basis points and 2’s 30’s close inverted by 56 basis points. The month was dominated by tighter spreads, a heavy new issue calendar and lower absolute yields.
The Fed sat idle in January, which gave the market the opportunity to focus on spreads, secondary paper, rates, and the new issue calendar. The Fed is set to hike rates on 2/1/2023 and we closed January with 2yr notes lower by -19 basis points, 10yr notes lower by 27 basis points and 30yr bonds lower by 23 basis points.
We ended 2022 in a challenging environment for issuers and syndicate desks, as they were forced to navigate windows of opportunity to issue new debt, while the market was full of challenges from execution, timing and difficult funding costs to Go-No-Go calls that were held weekly. We saw some deals price at initial price talk and in some cases wider than IPT.
January 2023 will be the second busiest January on record, with almost $144 billion for the month. The all-time most active January on record was 2017, when $174 billion was sold.
As we closed January, we saw a reversal of the challenges that plagued the markets in 2022, as spreads moved tighter, new issues saw a narrowing of new issue concessions and in some cases priced through secondary paper. Many new deals moved tighter post-pricing and performed very well in the secondary market.
We enter February with all eyes on the next Fed move, Friday’s unemployment data and the balance of earnings reports. February’s new issue projections are coming in at $100Bln.
Great job by the AmeriVet Securities team in January as we were a Co-Manager on $4Bln two-part deal for UBS Group, $2.15Bln three-part deal for MetLife, $1.8Bln two-part deal for Duke Energy Carolinas, $3.75Bln two-part deal for Credit Suisse, $3Bln four-part deal for Toyota Motor Credit and $6Bln three-part deal for Morgan Stanley.
The AmeriVet Securities sales team continues to bring in a large volume of differentiated orders from Tier II and Tier III accounts on new issue deals.


