January Credit Snapshot


In January, credit markets saw a strong new issue calendar that topped monthly expectations, as spreads were 5 to 25 basis points wider.
The U.S. Treasury market was flatter by 30 basis points as U.S. Treasury rates rose, amidst the Fed speculation of raising rates.
Spreads traded in a 10-30 basis point range in January as the markets saw volatility in every corner. The solid new issue calendar beat estimates of $125-140 billion, closing at $142.1 billion, the second largest January on record. It was unable to top January of 2017, which had $174 billion after a week and a half of volatility that saw just $2.8 billion of supply to close out the month. Secondary activity saw $623 million of net client selling to begin the year, as investors bought the new issue calendar and sold secondary credit to fund new issues.
January saw plenty of volatility in the markets – from the plunging equity markets, to the omicron variant that saw spiking numbers across the country. In addition, the continued supply chain issues, spiking energy prices, rising U.S. Treasury rates and the Fed meeting have all contributed to a difficult market for investors at the start of 2022.
| Issuance Stats | IG (ex-SSA) Total |
| MTD | $142.1 billion |
| YTD | $142.1 billion |
| Supply Run Rate | |
| IG Gross (ex-SSA) | YTD |
| 2022 | $142.1 billion (+11%) |
| 2021 | $127.5 billion |
IG credit spreads were 5 to 25 basis points wider and traded in a wide range for the month. The U.S. Treasury market saw a continued flattening trade with the 2yr note +40 basis points higher, the 10yr +16 basis points higher and the 30yr just +10 basis points higher.
The U.S. Treasury rates in January 2021 vs January 2022 saw the 2yr jump +1.05 basis points, 10yr +86 basis points and the 30yr +46 basis points – a huge contrast to the opening levels in January 2021, when the 2yr traded 0.13%, the 10yr 0.93% and the 30yr 1.65%.
The CDX Investment Grade Index opened 2022 at 49.68 on January 3 and steadily traded higher to the monthly high of 62.7 on January 27, before closing the month at 58.35 on January 31.
The Bloomberg Barclays U.S. Aggregate Average OAS opened January at 0.93 and steadily traded higher, closing the month at 1.06 on January 31. The average high-grade corporate bond spread hit a 16-year low of 0.80 basis points back on June 30, 2021.
See the charts below for more information.
U.S. Treasury Moves
December 31, 2021 – January 31, 2022
| 2yr U.S. Treasury | 10yr U.S. Treasury | 30yr U.S. Treasury | |||
| December 31 | 0.73% | December 31 | 1.52% | December 31 | 1.90% |
| January 3 | 0.78% | January 3 | 1.63% | January 3 | 2.01% |
| January 18 | 1.06% | January 18 | 1.87% | January 18 | 2.18% |
| January 31 | 1.18% | January 31 | 1.79% | January 31 | 2.11% |
CDX Investment Grade Index
![]()
CDX Investment Grade Index 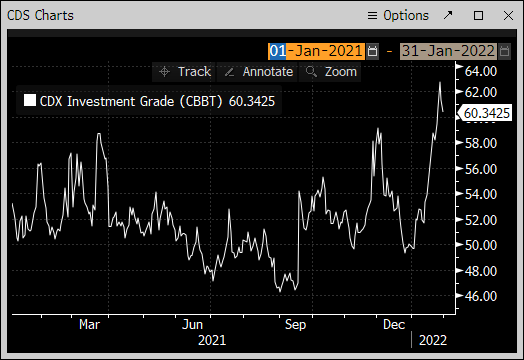
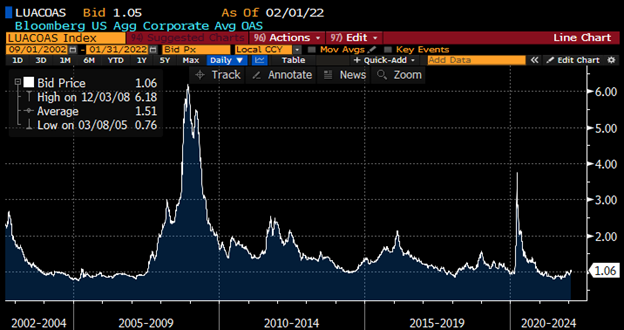
Bloomberg Barclays U.S. Aggregate Corporate Average OAS
January 31, 2021 – January 31, 2022
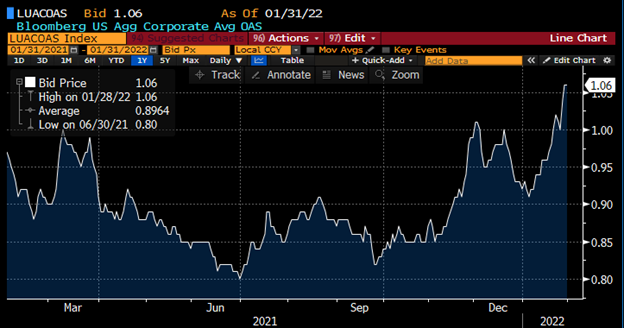
Bloomberg Barclays U.S. Aggregate Corporate Average OAS
September 1, 2002 – January 31, 2022
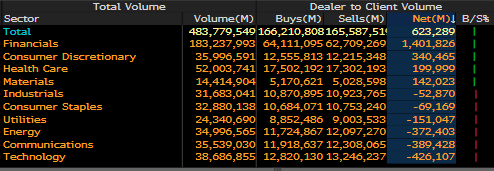
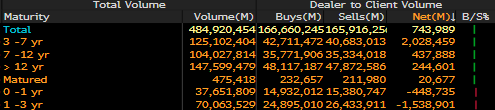
IG credit flows came in at $483 billion vs the trailing six months, with the December 2021 low of $372 billion, November 2021 at $439 billion, October 2021 at $458 billion, September 2021 at $464B billion vs August 2021 at $390 billion, July 2021 at $428 billion and finally, January 2021 at $525 billion. The trailing six-month average volume is $434 billion.
January’s strong new issue calendar saw portfolio managers who were eager to buy the new issue calendar, as the financial sector lead by the Money Center Banks came to market post-earnings and issued a robust $80 billion in new supply, accounting for 58% of the month’s new issue volume.
As U.S. Treasury rates spiked in January, investors continued the trend of putting money to work in the front end of the curve, with 0-3yr paper seeing over $1.9 billion of net client buying.
The belly of the curve, and longer, saw net client selling with 3-7yr paper at $2 billion. In addition, 7-12yr paper saw over $437million of net client selling and the 12yr and longer paper saw over $244 million of net client selling.
As we saw a pause in the new issue flows for a seven-day period, there was a massive spike of secondary buying in the third week of January, which helped to slow some of the net client selling.
The financial sector dominated net client selling in January with over $1.4 billion, along with consumer discretionary ($340 million), health care ($199 million) and materials ($142 million), while the rest of the sectors saw net client buying.
See the IG Credit Flow charts below for more information.
IG Credit Flows
January 2022
IG Credit Maturity Flows
January 2022
January saw a new issue calendar topping monthly expectations, rising U.S. Treasury rates, strong secondary trading flows and net client selling, which all contributed to spread widening.
The U.S. Treasury curve saw a flattening yield curve and a huge spike higher in rates. The credit markets saw a shift to heavy front end buying of the credit curve, following a massive year end buying of secondary paper across the curve.
We were expecting $125-140 billion of new supply, which came in at $142 billion, topping January 2021, which saw $127 billion come to market.
Despite all the volatility and spread widening, the credit markets have remained resilient. We have seen very orderly trading without any panic so far.
As we enter February 2022, there are plenty of headwinds to consider, such as Russia and Ukraine, rising U.S. Treasury rates and digesting the rest of earning season. In addition, we have the Fed navigating supply chain issues, worker shortages, energy prices and their message on raising rates, coupled with mid-term elections and “Covid fatigue,” as the world enters year three of the pandemic.
New issue projections for 2022 are calling for $1.1-1.7 trillion, with an average of $1.35 trillion, just below 2021’s record year end.
Great job by the AmeriVet Securities team in January, as we were joint-lead manager on a $3 billion two-part deal for UBS and co-managers on both a $1.2 billion two-part deal for Southern California Edison, and a $2.3 billion two-part deal for MUFG. In addition, we were joint-lead manager on a $1.25 billion deal for Morgan Stanley and had a co-manager role in ABS for a $1.75 billion Verizon deal, and served as junior co-manager on a $1.052 billion Ford Prime Auto Loan.
The AmeriVet Securities sales team kicked off 2022 by continuing to bring in large volumes of differentiated orders from Tier II and Tier III accounts on new issue deals.