July Credit Snapshot


In July, the credit markets saw a new issue calendar that fell shy of monthly expectations, as spreads were choppy and traded wider. The U.S. Treasury market continued its rally and saw a flattening trade for the third straight month, after a few months of a steepening trade.
Spreads traded in a wide range of 8 to 38 basis points and U.S. Treasuries rallied into the end of July. In addition, credit rebounded and closed at levels that were wider than in the beginning of the month. Credit spreads were unchanged at 15 basis points wider, reversing the move tighter in June.
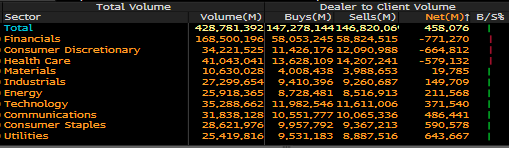
The new issue calendar fell just short of the monthly estimates of $90-100 billion and closed the month at $88.8 billion. Secondary activity in July saw net client selling of over $458 million, reversing net client buying that was seen in June.
Much like last month, secondary flows in July saw the first 15 days produce $1.6 billion in net client selling, vs the last 15 days of July which saw over $1.1 billion in net client buying, as investors scooped up credit into month end at wider levels.
| Issuance Stats | IG (ex-SSA) Total |
| MTD | $80.8 billion |
| YTD | $877.1 billion |
|
Supply Run Rate |
|
| IG Gross (ex-SSA) | YTD |
| 2021 | $877.1 billion |
| 2020 | $1,231.9 billion (-29%) |
| 2019 | $687 billion (+28%) |
IG credit spreads were unchanged to 15 basis points wider, as a strong U.S. Treasury market saw spreads move wider, although they rallied tighter off the wides into the end of July.
A rate rally pushed spreads tighter following the kickoff of quarterly earnings season and the Delta variant that has weighed on the markets.
The moves in the U.S. Treasury market continued to have investors constantly moving assets and that is driving the move in credit spreads. The U.S. Treasury market was active in July with 2yr notes 6 basis points lower, while in the long end the 10yr and 30yr Treasury’s both rallied, closing 24 and 18 basis points to end July.
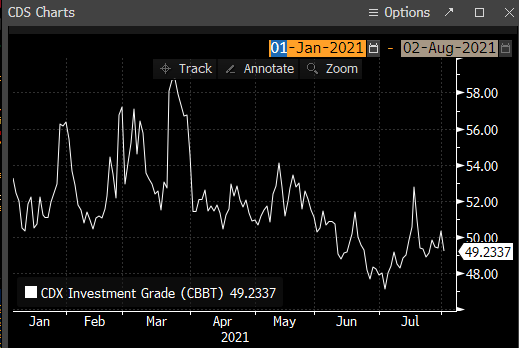
The CDX Investment Grade Index opened July at 48, trading as tight as 47.112 on July 2, moved steadily higher to 52.8 on July 19 and then moved lower to close the month at 49.23.
The Bloomberg Barclays U.S. Aggregate Average OAS opened July at 80 and traded in a 5 basis points range for the first two weeks, moved to the high for the month on July 19 at 88.5 and then moved slightly tighter to close at 85.3 on July 30.
The average high-grade corporate bond spread hit a 16-year low of 80.1 basis points back on June 30, to close out the month of June.
See the charts below for more information.
Treasury Moves
January 4, 2021 – July 30, 2021
| 2yr U.S. Treasury | 10yr U.S. Treasury | 30yr U.S. Treasury | |||
| January 4 | 0.13 % | January 4 | 0.93% | January 4 | 1.65% |
| February 1 | 0.09% | February 1 | 1.09% | February 1 | 1.84% |
| March 1 | 0.17% | March 1 | 1.45% | March 1 | 2.23% |
| March 31 | 0.16% | March 31 | 1.74% | March 31 | 2.41% |
| April 1 | 0.17% | April 1 | 1.69% | April 1 | 2.34% |
| April 15 | 0.16% | April 15 | 1.56% | April 15 | 2.23% |
| April 30 | 0.16% | April 30 | 1.65% | April 30 | 2.30% |
| May 3 | 0.16% | May 3 | 1.63% | May 3 | 2.30% |
| May 17 | 0.16% | May 17 | 1.64% | May 17 | 2.36% |
| May 28 | 0.16% | May 28 | 1.58% | May 28 | 2.26% |
| June 1 | 0.14% | June 1 | 1.62% | June 1 | 2.30% |
| June 15 | 0.16% | June 15 | 1.51% | June 15 | 2.20% |
| June 30 | 0.25% | June 30 | 1.45% | June 30 | 2.06% |
| July 1 | 0.25% | July 1 | 1.48% | July 1 | 2.07% |
| July 15 | 0.23% | July 15 | 1.31% | July 15 | 1.92% |
| July 30 | 0.19% | July 30 | 1.24% | July 30 | 1.89% |
CDX Investment Grade Index
![]()
CDX Investment Grade Index
Bloomberg Barclays U.S. Aggregate Corporate Average OAS
January 1, 2020 – July 30, 2021
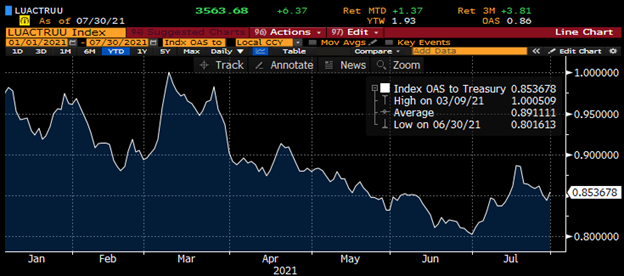
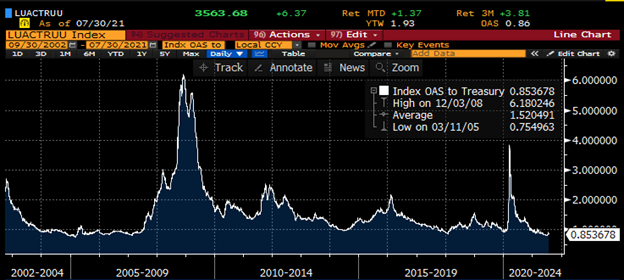
Bloomberg Barclays U.S. Agg Corporate Avg OAS
September 30, 2002 – July 30, 2021
In July, IG credit flows came in at the lowest levels of the year. This was $428 billion lower compared to $515 billion in June, $453 billion in May, $499 billion in April, March of $641 billion in March, February’s $512 billion in February and January’s $525 billion in January.
The trailing six-month average volume is $506 billion. A slower new issue calendar coupled with the kickoff in quarterly earnings, the rally in U.S Treasuries and the new Delta variant has put some volatility into the credit markets, as investors and portfolio managers continue to plow money into the front end of the credit curve.
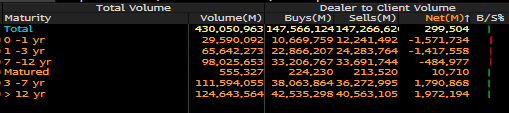
Financials again led the charge in July with over $771 million in net client buying with consumer discretionary at $664 million and healthcare at $579 million, while all other sectors saw net client selling.
We continue to see investors put money to work in secondary paper in the front end on the credit curve, as July saw over $1.5 billion in net client buying in 0-1yr, $1.4 billion in 1-3yr and $484 million in 7-12yr maturities.
See the charts below for more information.
IG Credit Flows
July 2021
IG Credit Maturity Flows
July 2021
This month saw a new issue calendar that came in shy of expectations, lighter secondary trading flows and volatility in spreads that closed July just off the wides, but still were unchanged to 15 basis points wider.
The U.S. Treasury curve saw another dip in rates and the credit market continues to see investors push money into the front end of the curve.
We are expecting $20-25 billion for the first week of August in new issue supply. Expectations in August fall in a wide range, from $65 billion to as much as $120 billion of new issue supply, with the average around $81 billion, matching July’s total.
The credit markets are beginning August with spreads still trading at or through post-credit crisis lows and funding costs for companies remain very attractive.
The new issue market for 2021 gross volume is now only 29% behind last year’s historic pace and the $877 billion in supply is 28% ahead of 2019, which is a more normalized comparison.
Great job by the Amerivet Securities team in July. We were co-managers on a $6 billion three-part transaction for Mitsubishi UFJ Financial Group, a $3 billion of 6NC5 tranche for Morgan Stanley and a $1.3 billion Royalty Pharma PLC two-part deal, as well as JP Morgan’s $2 billion PerpNC5 $25 Par Pfd at 4.20%, along with two structured products deals from JP Morgan Mortgage trust.
In addition, the Amerivet Securities sales team continues to bring in large volumes of differentiated orders from Tier II and Tier III accounts on new issue co-managed deals.