June Credit Snapshot


In June, the credit markets saw a new issue calendar that came in significantly lower than monthly expectations as spreads reversed course and closed significantly wider as continued inflation is playing witness to broad market volatility. Supply in June was disappointing at $69.1 billion, closing well below the $90 billion projected by dealers.
The U.S. Treasury market was flatter by 20 basis points as the Fed’s lack of control on U.S. inflation has the markets trading with apprehension and fear to close the first half of the year. Throughout the first half of 2022, we have seen a dramatic and violent repricing of risk assets.
Spreads traded in a 20-40 basis point range in June, as dealers and investors try to trade through all the market volatility. June saw very strong secondary activity but was heavily weighted with Net client selling of over $4.3 billion as the new issue calendar disappointed despite June being a historically heavy month in front of the summer slowdown.
June did see a heavy buy trade on the last day of the month as investors scooped up over $2.2 billion of net client buying on the months back up in spreads despite all the volatility as equities continue to see big swings, soaring energy prices, and daily volatility in U.S. Treasuries, all creating a difficult market to navigate for fixed income issuers, investors, and traders.
| Issuance Stats | IG (ex-SA) Total |
| MTD | $69.1 billion |
| YTD | $716 billion |
| Supply Run Rate | |
| IG Gross (ex-SSA) | YTD |
| 2022 | $716 billion (-10%) |
| 2021 | $795 billion |
IG Credit spreads were 15-45 basis points wider and traded in a wide range for the month(20-45Bps) closing at the month wides. The U.S. Treasury market flattened with the 2yr note rising +29 basis points, the 10yr +10 basis points and the 30yr closing the month +9 basis points higher. Mid-month saw spiking U.S Treasury levels with the 2yr peaking at 3.20%, 10yr & 30yr at 3.39% but that gave way to a rally in rates to close the month lower in yield.
Looking at U.S. Treasury rates in June, we saw the month begin with 2’s — 10’s at +21 basis points and 2’s — 30’s at +43 basis points, closing the month with 2’s — 10’s at +2 basis points and 2’s — 30’s at +23 basis points.
The Fed set the tone mid-month as a 75-basis point rate hike was necessary to try and combat soaring inflation and global market volatility that has created a very difficult market environment for market participants to navigate. All these factors are leading to higher costs of capital as the U. S. deals with supply chain issues, higher interest rates and the price at the pump.
The CDX index began June at 81.16 on June 1, spiked in the middle of the month to the high of 103 on June 16 and traded in a tight range into month end, to close at 101.82.
The Bloomberg Barclays U.S. Aggregate Average OAS opened June at 1.31 and traded steadily higher throughout the month, to close at 1.55 on June 30.
See the charts below for more information.
U.S. Treasury Moves
December 31, 2021 – June 30, 2022
| 2yr U.S. Treasury | 10yr U.S. Treasury | 30yr U.S. Treasury | |||
| December 31 | 0.73% | December 31 | 1.52% | December 31 | 1.90% |
| January 3 | 0.78% | January 3 | 1.63% | January 3 | 2.01% |
| January 18 | 1.06% | January 18 | 1.87% | January 18 | 2.18% |
| January 31 | 1.18% | January 31 | 1.79% | January 31 | 2.11% |
| February 1 | 1.18% | February 1 | 1.81% | February 1 | 2.19% |
| February 15 | 1.58% | February 15 | 2.05% | February 15 | 2.37% |
| February 28 | 1.46% | February 28 | 1.86% | February 28 | 2.19% |
| March 1 | 1.31% | March 1 | 1.72% | March 1 | 2.11% |
| March 15 | 1.85% | March 15 | 2.15% | March 15 | 2.49% |
| March 31 | 2.28% | March 31 | 2.32% | March 31 | 2.44% |
| April 1 | 2.44% | April 1 | 2.40% | April 1 | 2.44% |
| April 14 | 2.47% | April 14 | 2.66% | April 14 | 2.92% |
| April 29 | 2.70% | April 29 | 2.85% | April 29 | 2.96% |
| May 2 | 2.73% | May 2 | 2.99% | May 2 | 3.07% |
| May 16 | 2.58% | May 16 | 2.88% | May 16 | 3.09% |
| May 31 | 2.53% | May 31 | 2.85% | May 31 | 3.07% |
| June 1 | 2.66% | June 1 | 2.87% | June 1 | 3.09% |
| June 15 | 3.20% | June 15 | 3.39% | June 15 | 3.39% |
| June 30 | 2.95% | June 30 | 2.97% | June 30 | 3.18% |
CDX Investment Grade Index
June 2022
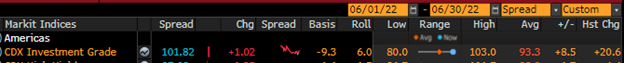
CDX Investment Grade Index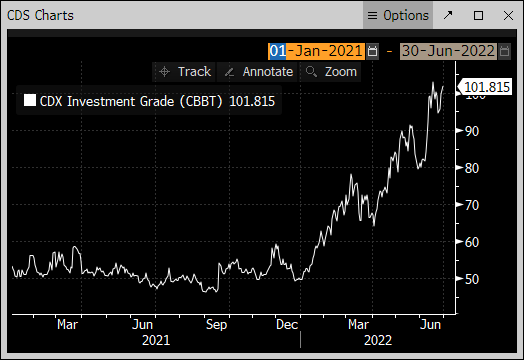
Bloomberg Barclays U.S. Aggregate Corporate Average OAS
January 1, 2021 – June 30, 2022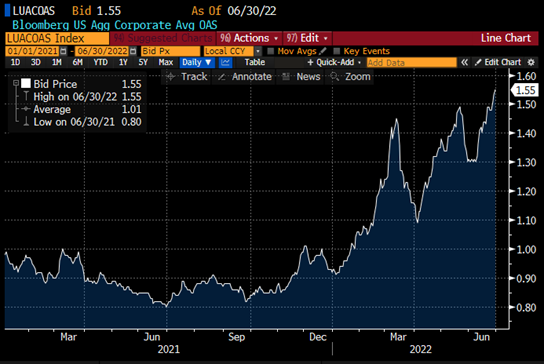 Bloomberg Barclays U.S. Aggregate Corporate Average OAS
September 1, 2002 – June 30, 2022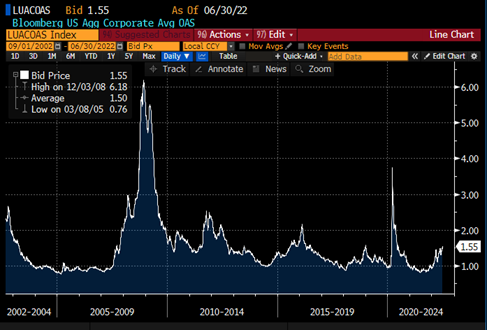
IG credit flows for the month of June came in at a solid $550 billion vs trailing months, with May at $549 billion, April at $541 billion, March at $630 billion, February at $489 billion, and January at $483 billion. The trailing six-month average volume is $540 billion.
June saw a lighter than expected new issue calendar and wider spreads along with the continued trend of net client selling, but we did see a solid last day of the month buying spree that saw over $2.2 billion of net client buying with all sectors seeing buying and almost all maturity buckets as well.
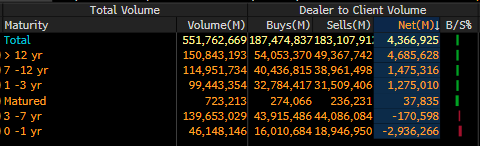
June saw $4.3 billion in net client selling which has investors reluctant to put money to work out the curve. The front end of the credit curve once again saw the lion share of net client buying with 0-1yr paper seeing over $2.9 billion of net client buying and 3-7yr paper seeing $170 million of net client buying. The 1-3yr and 7-12yr part of the credit curve saw net client selling of $2.75 billion, while 12yr and longer paper saw the bulk of net client selling of $4.6 billion.
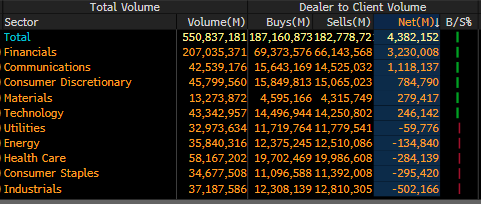
The financial sector once again dominated net client selling in June with over $3.2 billion, communications $1.11 billion, consumer discretionary $784 million, and materials $279 million.
June did see net client buying for Industrials ($502 million), consumer staples ($295 million), health care ($284 million) and energy ($134 million). From a ratings perspective Baa1/Baa3 paper saw over $2.4 billion of net client selling along with A1/A3 paper seeing over $2 billion of net client selling.
See IG Credit Flow charts below for more information.
IG Credit Flows by Sector
June 2022
IG Credit Maturity Flows
June 2022
IG Credit by Investment Grade Ratings
June 2022 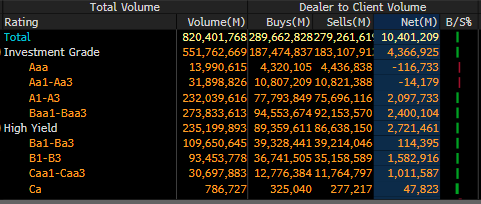
June saw a new issue calendar that missed monthly expectations, a flattening trade in U.S. Treasuries, solid secondary trading flows and continued net client selling as spreads moved to the widest level of the year to close the first half of 2022.
The U.S. Treasury curve flattened by 20 basis points (2’s rose +29Bps, 10’s +10Bps and the 30yr +9Bps).
As we look to July and the summer, the Fed’s next rate hike expected on July 27 will ultimately lead the markets as they react to the next move.
Chairman Powell has his work cut out for him along with the Fed governors as they try and get control of inflation and influence the markets in a positive way. The backdrop for issuance in the month of June was not inviting for potential borrowers with equity markets falling and Treasuries rising for the month.
The high-grade CDX index, a key measure of credit risk, was wider by 20 basis points in June and the Bloomberg Barclays U.S. Aggregate Corporate Investment-grade spread hit a two-year high of +155 basis points +24 basis points higher on the month as funding costs for borrowers continue to rise.
We have seen deals pulled, postponed, and cancelled due to all the market volatility. Tough times remain ahead as gas prices and inflation continue to be major roadblocks for the consumer. We enter July 2022 with all eyes on inflation, gas prices, next Friday’s unemployment data and the Fed’s next move on July 27.
July is typically a slower deal month with projections coming in at $15 billion for next week and $80 billion for the month, but after two straight months of missing expectations, the market backlog is building amidst global market volatility and very difficult issuance landscape.
Great job by the AmeriVet Securities team in June as we were a Co-Manager on $750 million deal for Ally Financial, Inc. The AmeriVet Securities sales team continues to bring in large volumes of differentiated orders from Tier II & Tier III accounts on new issue deals.