June Credit Snapshot


In June, the credit markets saw a new issue calendar that topped monthly expectations. Spreads were volatile and moved tighter into the month’s end and the treasury curve flattened for the second straight month after a few months of a steepening trade.
The summer kicked off with a steady performance in credit, despite inflation coming in hotter than expected and the Fed’s early signaling that it may hike a bit sooner than previous projections (signaling still not until 2023).
Spreads traded in broad range this month, as a volatile Treasury market had the credit markets slightly wider the first two weeks in June.
As U.S. Treasuries rallied toward the end of June, so did credit, closing the month at tighter levels, along with a busy new issue calendar.
Credit spreads in June were unchanged to 25 basis points tighter, with paper trading in a 5 to 30 basis point range. The new issue market exceeded estimates of $110 billion closing the month at $112.7 billion.
Secondary activity saw net client buying of over $154 million, but a deep dive into the numbers is necessary to see what was going on early in June vs the second half, and into the end of June.
In addition, the first 15 days of June saw $1.115 billion in net client selling vs the last 15 days, which saw over $1.338 billion in net client buying.
| Issuance Stats | IG (ex-SSA) Total |
| MTD | $112.7 Billion |
| YTD | $796.34 Billion |
| Supply Run Rate | |
| IG Gross (ex-SSA) | YTD |
| 2021 | $796.34 billion |
| 2020 | $1,176.9 billion (-32%) |
| 2019 | $595 billion (+34%) |
IG credit spreads were unchanged to 25 basis points tighter as U.S. Treasury volatility saw spreads wider in early June, and then rallied tighter into month-end, as a rate rally pushed spreads tighter.
The moves in the Treasury market continued to have investors moving money across the curve and that is driving the move in credit spreads. The Treasury market was active in June, with the curve flattening, as yields on 2yr bonds were 11 basis points higher. In the long end, the 10yr and 30yr Treasury both rallied, closing 17 and 24 basis points lower to the end of June.
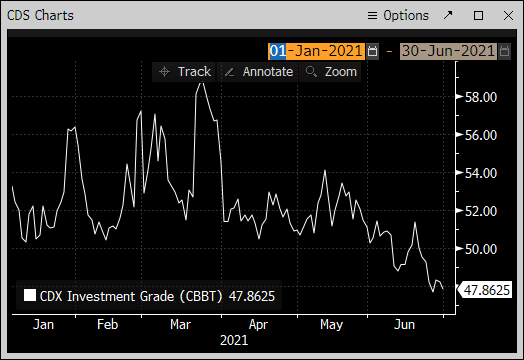
The CDX Investment Grade Index opened at 50.255 and moved to the month’s high level of 51.4 on June 3 and hovered around 51.38 until June 18.
The CDX index pushed tighter to 47.7 on June 25 and closed at 47.86.
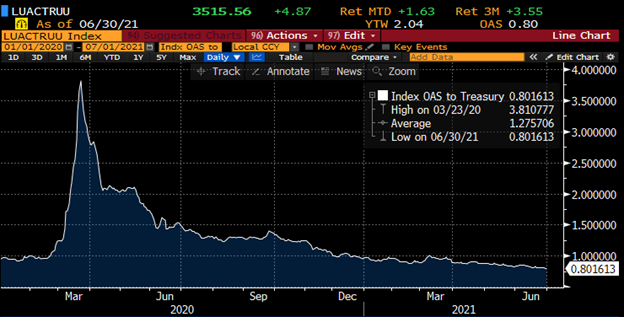
Bloomberg Barclays U.S. Aggregate Average OAS opened June at 84.7 and traded in a tight range for the first two weeks of the month, closing June 15 at 82.5, before moving tighter and closed the month at 80.16.
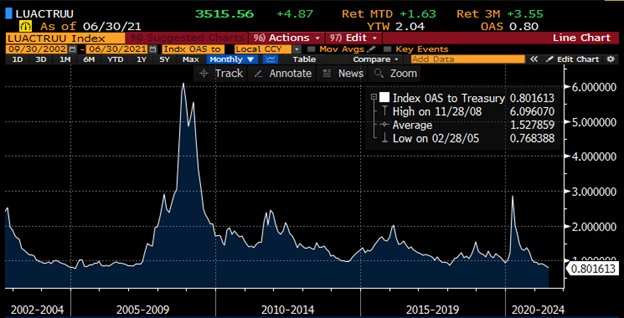
The average high-grade corporate bond spread hit a new 16-year low of 80.16 basis points to close out the month on June 30.
Funding costs for companies continue to remain at historically low levels, providing an ideal issuance environment for issuers.
See charts below for more information.
|
Treasury Moves January 4, 2021 – June 30, 2021 |
|||||
| 2yr U.S. Treasury | 10yr U.S. Treasury | 30yr U.S. Treasury | |||
| January 4 | 0.13 % | January 4 | 0.93% | January 4 | 1.65% |
| February 1 | 0.09% | February 1 | 1.09% | February 1 | 1.84% |
| March 1 | 0.17% | March 1 | 1.45% | March 1 | 2.23% |
| March 31 | 0.16% | March 31 | 1.74% | March 31 | 2.41% |
| April 1 | 0.17% | April 1 | 1.69% | April 1 | 2.34% |
| April 15 | 0.16% | April 15 | 1.56% | April 15 | 2.23% |
| April 30 | 0.16% | April 30 | 1.65% | April 30 | 2.30% |
| May 3 | 0.16% | May 3 | 1.63% | May 3 | 2.30% |
| May 17 | 0.16% | May 17 | 1.64% | May 17 | 2.36% |
| May 28 | 0.16% | May 28 | 1.58% | May 28 | 2.26% |
| June 1 | 0.14% | June 1 | 1.62% | June 1 | 2.30% |
| June 15 | 0.16% | June 15 | 1.51% | June 15 | 2.20% |
| June 30 | 0.25% | June 30 | 1.45% | June 30 | 2.06% |
CDX Investment Grade Index
![]()
CDX Investment Grade Index
Bloomberg Barclays U.S. Aggregate Corporate Average OAS
January 1, 2020 – June 30, 2021
Bloomberg Barclays US Agg Corporate Avg OAS
September 30, 2002 – June 30, 2021
IG credit flows were strong and came in at $515 billion. This was higher compared to $453 billion in May, $499 billion in April, $641billion in March, $512 billion in February and $525 billion in January. The trailing six-month average volume is $524 billion.
The solid new issue calendar and the move in U.S Treasuries gave way to strong secondary flows as investors and portfolio managers moved paper across the credit curve for the fourth month in a row.
We have seen U.S. Rate volatility push spreads tighter again, causing continued demand for secondary paper in the front end of the curve in 0-3yr paper.
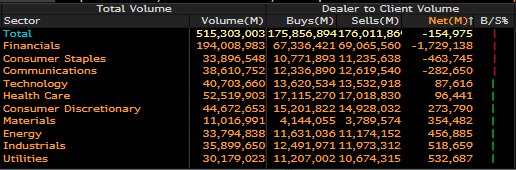
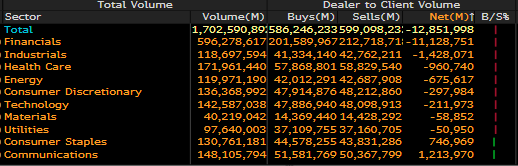
Financials again led the charge with over $1.7 billion in net client buying, with consumer staples $463 million and communications $282 million, while all other sectors saw net client selling.
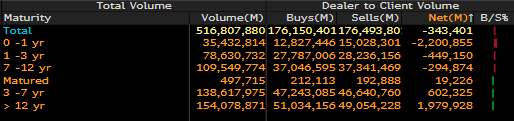
The story continues to be where investors are putting money to work in secondary paper on the credit curve and June continued that trend as we saw 12-30yr paper see over $1.9Bln in net client selling along 3-7yr maturities seeing $643mm.
The front end of the curve in June saw 0-1yr paper with $2.2 billion of net client buying, 1-3yr saw $470 million of net client buying and 7-12yr maturities saw $308 million of net client buying.
Looking back to January 1, 2021, and at the trailing six months, investors have been plowing money into 0-3yr maturities with over $11 billion in net client buying.
See the charts below for more information.
IG Credit Flows
June 2021
IG Credit Maturity Flows
June 2021
Six Month IG Credit Maturity Flows
January 1, 2021 – June 30, 2021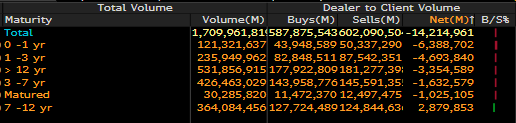
Six Month IG Credit Sector Flows
January 1, 2021 – June 30, 2021
This month saw a new issue calendar that topped monthly expectations, strong secondary trading flows and volatility in spreads, giving way to tighter levels at month-end.
The U.S. Treasury curve saw another dip in 10yr and 30yr rates and the credit market continues to see investors push money into the front end of the curve.
We are expecting $90 – 100 billion for next month in new issue credit. The credit markets are beginning July with spreads through post-credit crisis lows and funding costs for companies remain very attractive.
Gross volume in the first half 2021 was 32% behind last year’s historic pace and the nearly $800 billion in supply is 34% ahead of 2019, which is a more normalized pace. Dealers are calling for as much as $100 billion in July.
Great job by the AmeriVet Securities team this month, as we were co-managers on a $5 billion of a four-part deal from Goldman Sachs, $600 million Baltimore Gas and Electric, and a $1.5B billion two-part deal from Enbridge, as well as structured products deals from JP Morgan, Morgan Stanley and a GSE deal for Ginnie Mae.
The AmeriVet Securities sales team continues to bring in large volumes of differentiated orders from Tier II and Tier III accounts on new issue co-managed deals.