March Credit Snapshot


The credit markets in March fell short of monthly expectations, as volatility picked up dramatically from the mini banking crisis and caused mixed spreads along with lower U.S. Treasury rates.
The new issue calendar came in at $100.14Bln, missing expectations by almost $50Bln on expectations of $150Bln. The U.S. Treasury market saw 2’s—10’s close inverted by 58 basis points after beginning the month inverted by 88 basis points and 2’s-30’s inverted by just 39 basis points at month end after opening the month inverted by 92 basis points, as a flight to quality trade saw U.S. Treasuries rally.
Spreads were mixed from 10 basis points tighter to 150 basis points wider depending on sector and sub sectors and traded in a 40-150 basis point range on the month. March saw heavy secondary trading activity sparked by the mid-month bank crisis that saw bank and financial spreads snap wider. On the month we saw $1.8Bln in net client selling with spreads moving wider but with investors buying the massive back up in spreads for select issues the net client selling was not as much as it could have potentially been.
In the lead up to the mini bank crisis, as spreads were moving wider, we had been saying the market has been very orderly and spreads are hanging in there, and then the market pivoted and was not orderly.
Concerns remain in the market for the regional bank space and the Fed’s next move, as investors, issuers and traders try to navigate difficult market conditions. With spreads wider and U. S. Treasury rates closing the month lower, a rally into month end seems to have calmed the markets for now.
| Issuance Stats | IG (ex-SSA) Total |
| MTD | $100.14Bln |
| YTD | $349.89Bln |
|
Supply Run Rate |
|
| IG Gross (ex-SSA) | YTD |
| 2023 | $394.89Bln |
| 2022 | $453.3Bln |
| 2021 | $437.1Bln |
IG Credit spreads were 10 basis points tighter to 150 basis points wider and traded in a massive range for the month (40-150 basis points). Financials took the brunt of the spread widening, along with the sub-sector of regional banks.
The U.S. Treasury market saw 2yr notes lower by -83 basis points, 10yr notes lower by -53 basis points and the 30yr closing the month lower by -30 basis points as the flight to quality trade pushed yields lower. Looking at U.S. Treasury rates in March we saw the month begin with 2’s — 10’s inverted by 88 basis points and 2’s — 30’s by 92 basis points, closing the month with 2’s — 10’s inverted by 58 basis points and 2’s — 30’s inverted by 39 basis points.
The Fed raised rates on March 22 by 25 basis points, as many debated if they should be raising rates in the middle of a banking liquidity crisis. Just before the issues started with Silicon Valley Bank, there was talk of the Fed raising rates 50 basis points. The Fed will meet not again until May 3, giving them plenty of time to see important data releases on employment, earnings, and inflation before they make their next move.
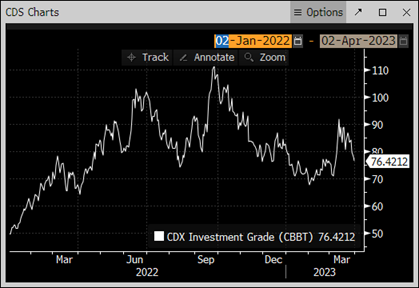
The CDX index started the month at 75.78 and traded in a tight range until 3/10/23 at 83.38 and moved to the monthly high of 91.8 3/13/23 as volatility entered the market and then we saw a rally into month end closing at 76.42 on 3/31/23.
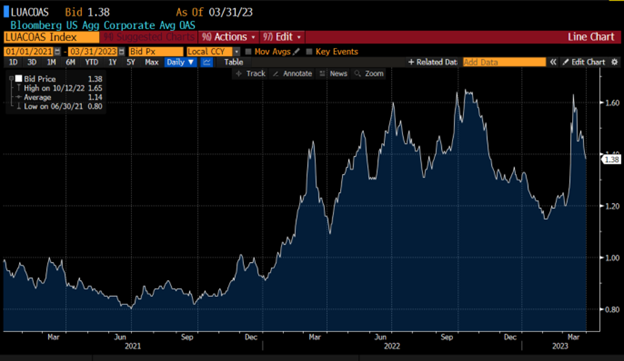
The Bloomberg Barclays US Agg Avg Oas opened March 23’ at 1.25 and traded lower into 1.20 on 03/03/23 and moved higher on the month’s volatility to the high of 1.63 on 3/15/23 before rallying into month end to close at 1.38. March levels for the index come on the heels of 1.15 low on the year on 2/02/23 and 1/31/23 at 1.17.
See the charts below for more information.
U.S. Treasury Moves
1/31/22 to 3/31/23
| 2yr U.S. Treasury | 10yr U.S. Treasury | 30yr U.S. Treasury | |||
| 1/31/22 | 1.18% | 1/31/22 | 1.79% | 1/31/22 | 2.11% |
| 12/01/22 | 4.25% | 12/01/22 | 3.53% | 12/01/22 | 3.64% |
| 12/15/22 | 4.23% | 12/15/22 | 3.44% | 12/15/22 | 3.48% |
| 12/30/22 | 4.41% | 12/30/22 | 3.88% | 12/30/22 | 3.97% |
| 1/03/23 | 4.40% | 1/03/23 | 3.79% | 1/03/23 | 3.88% |
| 1/17/23 | 4.18% | 1/17/23 | 3.53% | 1/17/23 | 3.64% |
| 1/31/23 | 4.21% | 1/31/23 | 3.52% | 1/31/23 | 3.65% |
| 2/01/23 | 4.09% | 2/01/23 | 3.39% | 2/01/23 | 3.55% |
| 2/13/23 | 4.52% | 2/13/23 | 3.72% | 2/13/23 | 3.79% |
| 2/28/23 | 4.81% | 2/28/23 | 3.93% | 2/28/23 | 3.92% |
| 3/01/23 | 4.89% | 3/01/23 | 4.01% | 3/01/23 | 3.97% |
| 3/15/23 | 3.93% | 3/15/23 | 3.51% | 3/15/23 | 3.70% |
| 3/31/23 | 4.06% | 3/31/23 | 3.48% | 3/31/23 | 3.67% |
CDX Investment Grade Index March 2023

CDX Investment Grade Index March 2023
Bloomberg US Agg Corporate Avg OAS 01/01/21—3/31/23
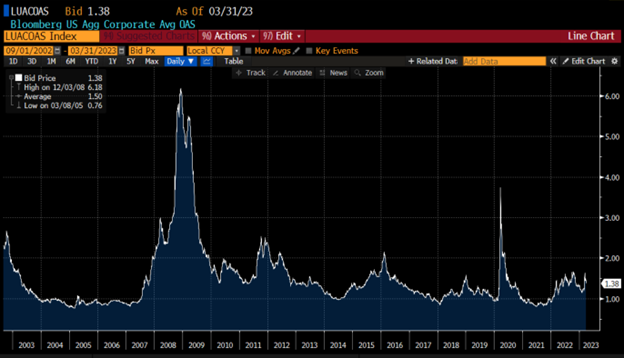
Bloomberg Barclays US Agg Corporate Avg OAS 09/01/02—03/31/23
IG credit flows in the month of March came in at a hefty $683Bln vs trailing months, February $617, January $620Bln, December $467Bln, November $566Bln, October $574Bln, and September $576Bln. The trailing six-month average volume is $587 billion.
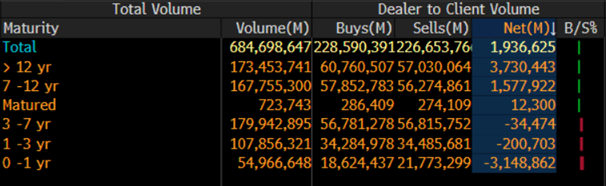
March saw a light new issue calendar that missed expectations and saw volatility and wider spreads along with net client selling on solid volume. In addition, this month we saw $1.8Bln in net client selling. The 12yr and longer part of the credit curve led the selling with $3.7Bln, 7-12yr saw $1.5Bln while 0-1yr saw over $3.1Bln of net client buying and 1-3yr paper and 3-7yr saw light net client buying.
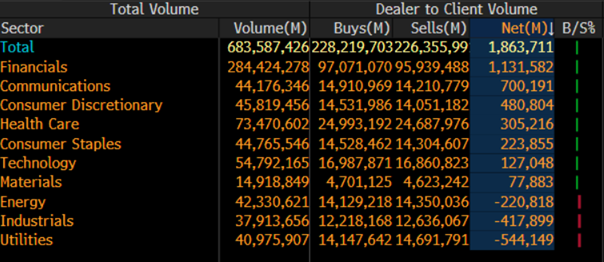
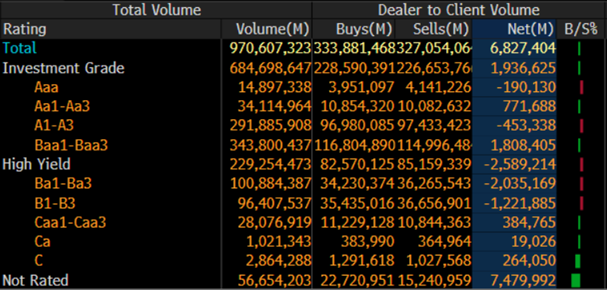
Almost all sectors saw net client selling with Financials seeing $1.1Bln, Communications $700mm and Consumer Discretionary saw $480mm while Utilities, Industrials and Energy saw light net client buying. Looking at the markets from a ratings perspective, A1-A3 paper saw net client buying of $453mm, Baa1-Baa3 paper saw $1.8BlnBln of net client selling and Aa1-Aa3 paper saw $771mm and Aaa paper saw $190mm of net client buying.
See IG Credit Flow charts below for more information.
March 2023 IG Credit Flows by Sector
March 2023 IG Credit Maturity Flows
March 2023 IG Credit by Investment Grade Ratings
March’s new issue calendar missed monthly expectations, while the U.S. Treasury curve saw rates move lower and a curve that was less inverted. We saw heavy secondary trading flows for the third month in a row that led to net client selling, as spreads were mixed on mid-month volatility. The U.S. Treasury curve saw 2’s 10’s close inverted by 58 basis points and 2’s 30’s inverted by 39 basis points.
The Fed was in play in March and executed a 25-basis point rate hike amidst a mini banking crisis with regional banks taking the spotlight along with key economic data which pushed the market to lower rates and volatile spreads making it a tougher market for all market participants to navigate. The Fed is not set to meet again until May 3. Prior to the Mini Banking crisis, the notion of a 50 basis point fed rate hike for the March 22 Fed meeting was being debated but the bank crisis for Silicon Valley Bank, Signature Bank, Silvergate Bank and Credit Suisse led the volatility and a coordinated plan of attack by the Fed, FDIC, U.S. Treasury dept, Private capital and the Money Center Banks to stem the tide on a further run on the banks. For the month of April all eyes will remain on the banking sector along with first quarter earnings and key data releases.
For the moment, this mini banking crisis seems contained, as a rally into month end in credit saw spreads in many sectors retrace the move wider and closed closer to unchanged and in some cases tighter on the month. April is expecting $100Bln of new deals and $15Bln for the first week.
Great job by the AmeriVet Securities team in March, as we were a Co-Manager on $7Bln three-part deal for HSBC Holdings, $3Bln two-part deal for Enbridge, $1.5Bln WarnerMedia Holdings 3yr deal, $400mm 10yr for Louisville G & E and $400mm 10yr for Kentucky Utilities.
The AmeriVet Securities sales team continues to bring in a large volume of differentiated orders from Tier II and Tier III accounts on new issue deals.