October 2020

In October, the credit markets saw $80.142 billion in new deals, while spreads on secondary paper tightened, despite continued volatility that dominated risk assets. Spreads reversed September’s move wider and closed tighter, as we saw spreads in credit trade in wide ranges from 10-65 basis points in the midst of the month’s volatility.
The new issue market topped estimates of $75 billion, well below record numbers in September, topping September 2019’s record for new supply. October was consumed by a race to election day and an economy that was challenged daily by coronavirus spikes, as Congress was unable to agree upon extending the Stimulus Relief Package for the American worker.
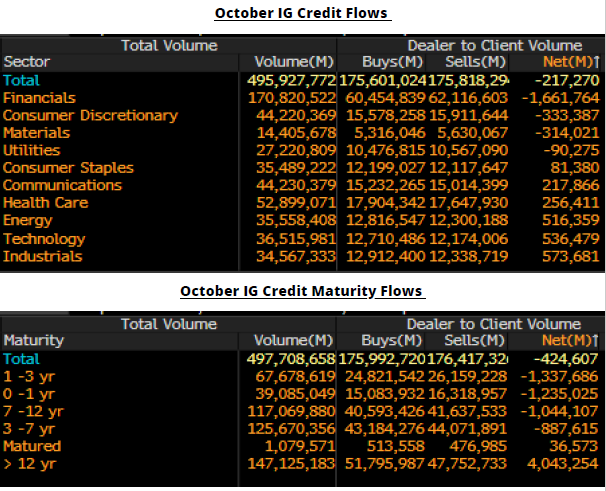
Secondary activity saw net client buying of $217 million, as financials led the charge with over $1.6 billion in net client buying. Despite all the volatility, the support from the Federal Reserve continues to make a strong impact on the market, as monetary and fiscal stimulus programs have solidly helped the credit markets and sustained a backdrop that has given confidence to fixed income investors to continue to buy credit assets. The big question remains – how long can that last?
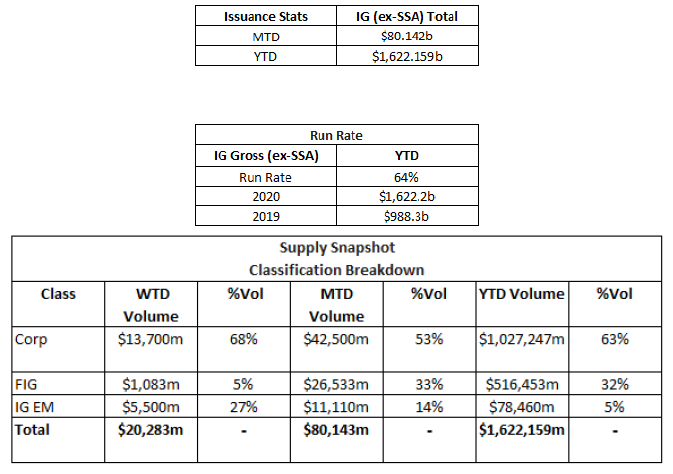
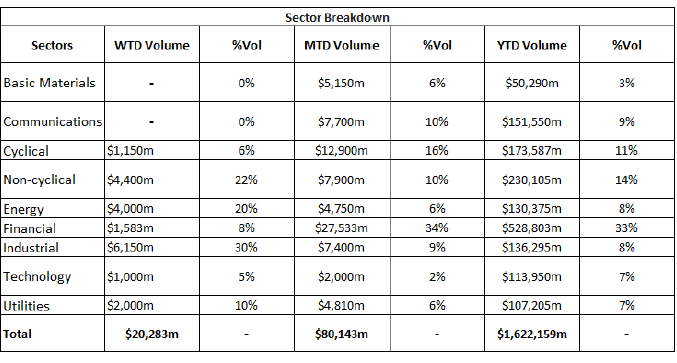
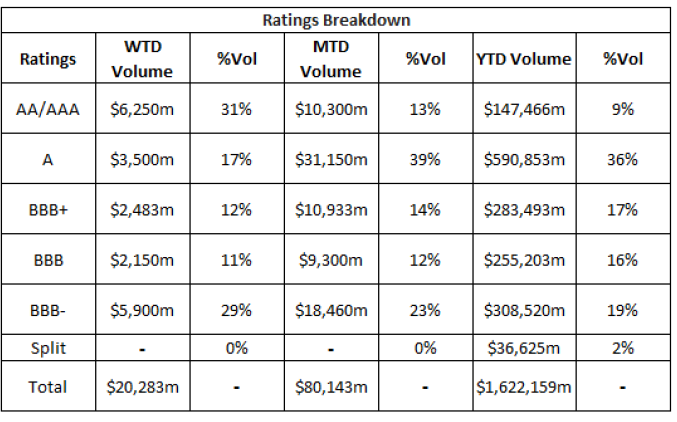
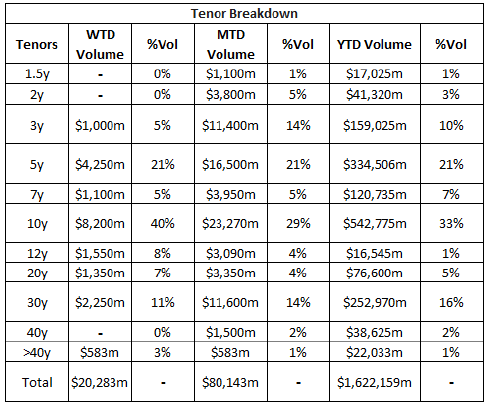
In October, IG Credit spreads were 5-35 basis points tighter, even as volatility remained in the market, following September’s move wider in spreads. The volatility we saw in October lent itself to some wide trading ranges, with strong rated credits trading in 10-35 basis point ranges and lower rated triple B paper trading in 35-65 basis point ranges.
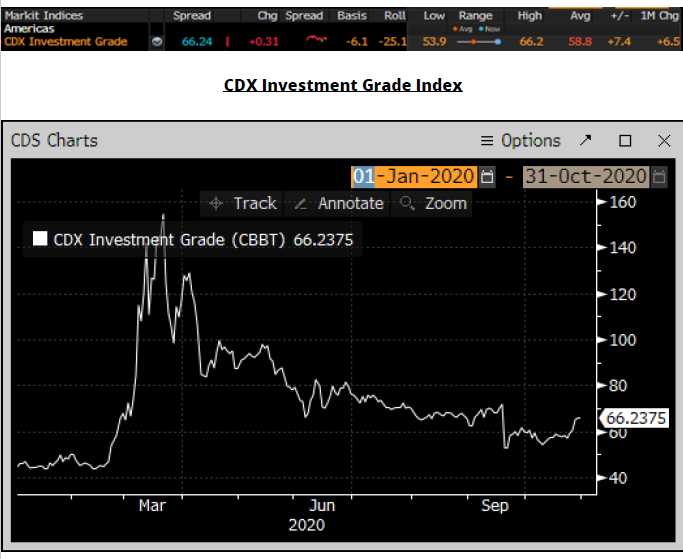
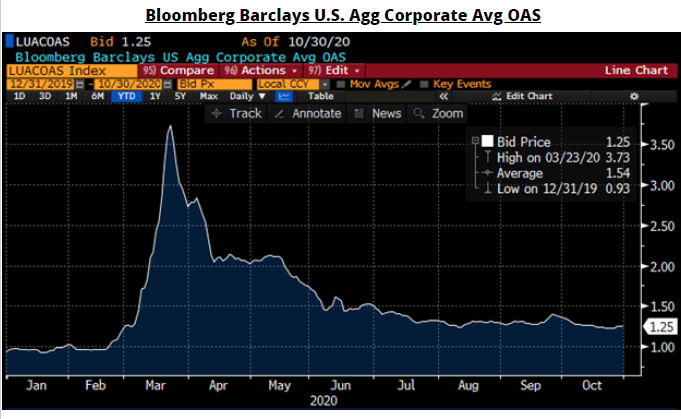
Credit has been on a crazy ride from the beginning of 2020, as spreads traded at the YTD tights in mid-February; as coronavirus started to impact the market, spreads pushed out to the wides in mid-to-late March and went on a full rip tighter in April that had spreads 50 to 100 basis points tighter. The tightening we saw from May through August had spreads at, or approaching, pre-coronavirus levels and were tighter, in some cases.
September’s spread widening brought net client selling, but October spreads rebounded and are again moving closer to the tights of the year. The CDX investment Grade Index opened October at 59.017 and traded as tight as 53.9 on October 9, before moving wider and closing the month at the wide of 66.2 on October 30.
The Bloomberg Barclays U.S. Agg Avg OAS closed out at 1.25, just off the tights of the month, with 1.23 on October 22. Despite the volatility seen this month, we opened October at 1.35 and like the move in spreads, pushed the index tighter.
See the charts below for more information.
October IG credit flows came in at $495 billion, topping September’s $446 billion, vs August $411 billion, July at $482 billion, June at $604 billion, May at $598 billion, April at $607 billion, March at $599 billion, February at $428 billion and January at $457 billion. The YTD avg monthly volume is $513 billion.
This month’s lighter new issue calendar also paved the way for stronger demand for secondary paper, as spread tightening brought $217 million of net client buying, reversing September’s $1.9 billion of net client selling vs net client buying in August of $715 million and $9.303 billion of net client buying in July, while June came in at $1.601 billion. The bulk of net client buying in October was in the 1-3yr part of the curve ($1.3billion), 0-1yr
($1.2 billion), 7-12yr ($1 billion) and 3-7yr ($902 million) with 12-30yr paper net client selling of just over $4 billion.
Financials led the charge in net client buying with $1.66 billion along with consumer discretionary and materials and utilities, while consumer staples, communications, health care, energy, technology and industrials all saw net client selling.
See charts below for more information.
October saw a lighter new issue calendar that still topped monthly expectations, strong spread tightening and solid secondary trading flows that topped September’s numbers, despite volatility that remained in the market as we raced toward November and the U.S. presidential election.
The Federal Reserve’s programs continue to buoy the markets and they have pledged to do whatever it takes to keep the economy moving forward, also signaling they will keep rates at, or close to zero, until we get back to unemployment levels near 3.5%.
Spreads moved tighter in October, reversing September’s move wider, despite continued volatility in the market. Solid net client buying of secondary paper benefitted from a lighter new issue calendar than previous record setting months. Since March 17, over$1.36 trillion has priced with 2020 supply, shattering 2017’s $1.3 trillion record.
As October comes to a close, we anticipate a bumpy ride into the U.S. presidential election and potentially the days after. As a winner emerges, continued volatility and a slowing new issue calendar for November has a wider range of estimates calling for $10-100 billion in new supply, with consensus numbers calling for $70-75 billion.
Coronavirus, a vaccine and the economy remain at the forefront of daily conversations away from the markets. There is hope for an immediate winner in the election and that it does not drag on for weeks, which would bring further volatility and uncertainty for risk assets along with it.
This past month, Amerivet Securities was co-manager on three-part $2.75 billion deal for Toyota Motor Credit, co-manager on $1.1 billion $25 4.375% PFD for Bank of America and co-manager on a $342 million structured products deal for JP Morgan Mortgage Trust. In addition, our firm was selling group member on a $953 million ABS deal for Verizon.
Stay safe and be well!


