September Credit Snapshot


In September, the credit markets saw a strong new issue calendar that topped monthly expectations. Spreads were unchanged to 10 basis points tighter for the second straight month, after July’s move wider to close out the third quarter. In addition, the Treasury market steepened again for the second month in a row.
Spreads traded in a 5-15 basis point range, as credit saw inter-week volatility, but no major shift that materialized over the month.
The new issue calendar topped monthly estimates of $130 – $140 billion, closing September at $158.2 billion. Secondary activity saw net client selling over $1.9 billion, following August and July’s trend of net client selling.
For the third straight month, secondary flows saw the first 15 days produce massive net client selling of $2.2 billion, followed by a wave of evenly balanced net client buying and selling, closing the month just under $2 billion.
September saw plenty of distractions and undercurrents affecting the markets, including moves in rates and equities, supply chain issues, spiking energy prices, worker shortages, inflation and the Fed (take your pick). This should lead to an interesting fourth quarter and end of year.
| Issuance Stats | IG (ex-SSA) Total |
| MTD | $158.2 billion |
| YTD | $1,121.5 billion |
| Supply Run Rate | |
| IG Gross (ex-SSA) | YTD |
| 2021 | $1,121.5 billion |
| 2020 | $1,542 billion (-27%) |
| 2019 | $923.6 billion (+21%) |
IG credit spreads were unchanged to 10 basis points tighter, as spreads traded in a narrow range for the month.
In addition, there is a lot weighing on the markets, such as inflation concerns, the Fed and the timing of Fed tapering – all of which are affecting the way investors have chosen to put money to work in the market.
The U.S. Treasury market was less volatile than previous months but as we moved into the end of September, that changed and we saw a major shift in equities, along with the recent Fed meeting, leading to the U.S. Treasury market steepening out to close the month, as yields spiked.
The Treasury market saw 2yr notes rise 8 basis points higher, while in the long end, the 10yr and 30yr Treasury’s both saw rates rise, closing 21 and 16 basis points to end the month.
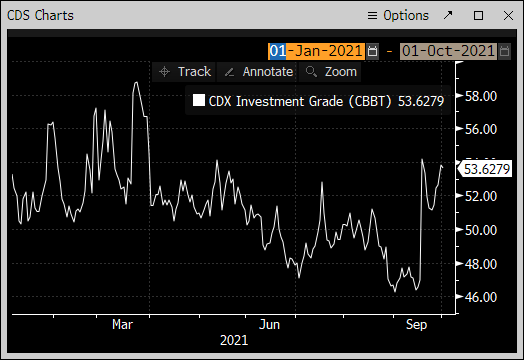
The CDX Investment Grade Index opened September at 46.3, trading at the month’s tight then trading in a narrow range until mid-month, before spiking to the month’s high of 54.2 on September 20 and closed the month at 52.86.
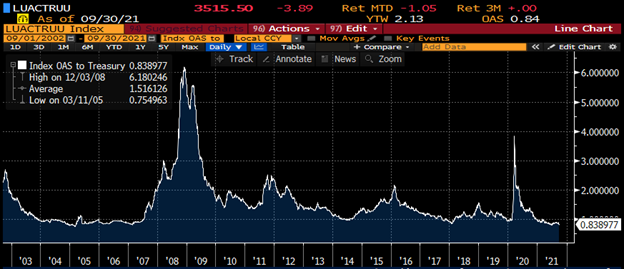
The Bloomberg Barclays U.S. Aggregate Average OAS opened the month at 87.6 and traded in a tight range, with the average monthly OAS at 85.3, before reaching a monthly tight of 81.2 on September 27 and closing at 83.8 on September 30. The average high-grade corporate bond spread hit a 16-year low of 80.1 basis points back on June 30.
See the charts below for more information.
Treasury Moves
January 4, 2021 – September 30, 2021
| 2yr U.S. Treasury | 10yr U.S. Treasury | 30yr U.S. Treasury | |||
| January 4 | 0.13 % | January 4 | 0.93% | January 4 | 1.65% |
| February 1 | 0.09% | February 1 | 1.09% | February 1 | 1.84% |
| March 1 | 0.17% | March 1 | 1.45% | March 1 | 2.23% |
| March 31 | 0.16% | March 31 | 1.74% | March 31 | 2.41% |
| April 1 | 0.17% | April 1 | 1.69% | April 1 | 2.34% |
| April 15 | 0.16% | April 15 | 1.56% | April 15 | 2.23% |
| April 30 | 0.16% | April 30 | 1.65% | April 30 | 2.30% |
| May 3 | 0.16% | May 3 | 1.63% | May 3 | 2.30% |
| May 17 | 0.16% | May 17 | 1.64% | May 17 | 2.36% |
| May 28 | 0.16% | May 28 | 1.58% | May 28 | 2.26% |
| June 1 | 0.14% | June 1 | 1.62% | June 1 | 2.30% |
| June 15 | 0.16% | June 15 | 1.51% | June 15 | 2.20% |
| June 30 | 0.25% | June 30 | 1.45% | June 30 | 2.06% |
| July 1 | 0.25% | July 1 | 1.48% | July 1 | 2.07% |
| July 15 | 0.23% | July 15 | 1.31% | July 15 | 1.92% |
| July 30 | 0.19% | July 30 | 1.24% | July 30 | 1.89% |
| August 2 | 0.17% | August 2 | 1.20% | August 2 | 1.86% |
| August 15 | 0.21% | August 15 | 1.26% | August 15 | 1.92% |
| August 31 | 0.20% | August 31 | 1.30% | August 31 | 1.92% |
| September 1 | 0.20% | September 1 | 1.31% | September 1 | 1.92% |
| September 15 | 0.21% | September 15 | 1.31% | September 15 | 1.87% |
| September 30 | 0.28% | September 30 | 1.52% | September 30 | 2.08% |
CDX Investment Grade Index
![]()
CDX Investment Grade Index
Bloomberg Barclays U.S. Aggregate Corporate Average OAS
January 1, 2020 – September 30, 2021
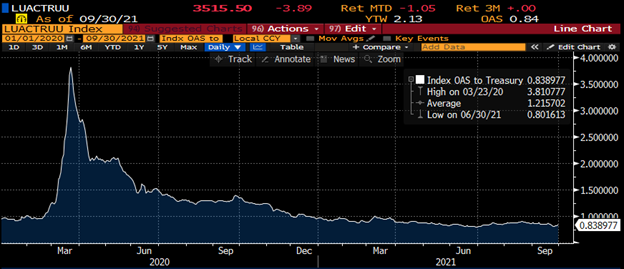
Bloomberg Barclays U.S. Aggregate Corporate Avg OAS
September 30, 2002 – September 30, 2021
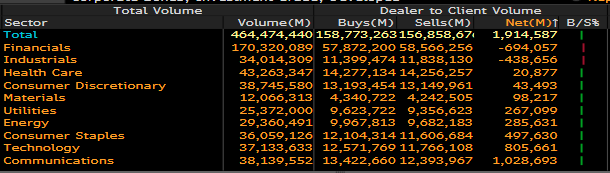
IG credit flows were stronger this month, coming in at $464 billion. This is compared to $390 billion in August, $428 billion in July, $515 billion in June, $453 billion in May, $499 billion in April, $641 billion in March, $512 billion in February and $525 billion in January. The trailing six-month average volume is $458 billion.
September’s massive new issue calendar, along with the undercurrents in the marketplace, has the credit markets continuing to plow money into the front end of the credit curve.
Investors continued that trend and this month we saw over $697 million in net client buying in 1-3yr, $816 million 0-1yr and $1.7 billion in 3-7yr maturities.
On the flipside this month, we saw net client selling of over $1.4 billion in 7-12yr and $3.4 billion in 12-30yr paper.
See the charts below for more information.
IG Credit Flows
September 2021
IG Credit Maturity Flows
September 2021 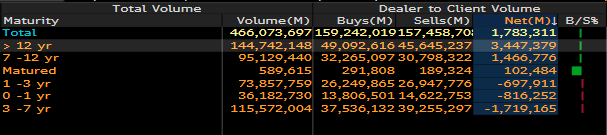
This month saw a new issue calendar that topped monthly expectations, stronger secondary trading flows and tighter spreads that closed September.
The U.S. Treasury curve saw a rise in rates and the credit market continues to see investors plowing money into the front end of the credit curve.
We are expecting $90 – $100 billion of new issue supply in October. The credit markets are beginning the month with spreads a touch wider and projections for the week are calling for $20 billion in new supply.
The new issue market gross volume for 2021 is -27%, behind last year’s historic pace and the $1,121.5 billion in supply is 21% ahead of 2019, which is a more normalized comparison.
As we enter the fourth and final quarter, the Fed has their work cut out for them. They must navigate inflation fears, tapering, supply chain issues, worker shortages and energy prices. Both the primary and secondary credit markets will try and react to all of these undercurrents affecting the markets.
Great job by the AmeriVet Securities team in September as we were co- managers on a $2 billion Bank of America 15NC5 deal and a $700 million 10yr for Pershing Square Holdings. In addition, the firm was joint bookrunner on Walmart’s $2 billion 10yr Green Bond.
The AmeriVet Securities sales team continues to bring in large volumes of differentiated orders from Tier II and Tier III accounts on new issue deals.