US Corporates and the Importation of Negative Yields


Global Negative Yields Reach the Shores of US Sovereign & Corporate Debt
Throughout the month of August, markets reached a heightened sense of curiosity with the negative global yield pool topping $16 trillion. Although yields globally have been negative for years, the latest push this summer in the United Sates took many by surprise with US long bonds moving 60-basis points lower within a very short period of time. At the same time, the US benchmark 2/10 yield curve inverted briefly, sparking discussion of recession and its broader implication.
Negative Global Rates & the US Markets
On September 5th, we penned a note to clients expressing a view US rates had moved too far. And that the move in many ways from August had spilled over to the US markets as pension funds and insurance companies were feeling the squeeze of maintaining proper funding levels as the liability side increased. A dynamic we referred to as a “negative convexity” loop whereas, the further negative rates moved the more buying that needed to be done.
Global liability managers have been facing a challenging environment. When the pool of available positive yielding assets declines, alternatives need to be considered. Without a question, both the US Treasury market and Corporate Investment grade market have been the beneficiaries of the buying over the past month and a half. Although US 10-year rates have backed up by 40-basis points consistent with our view for a correction, corporate spreads remain very tight.
Context: Rates versus Spreads & the Impact of Negative Yields in the US
We think it’s important to provide some context regarding the impact we feel negative global rates are having in the US. In other words, the dynamics are very unique and present a powerful window of time for corporate issuers in the US to capitalize on.
US Rates & Investment Grade Credit (2015-2016 vs 2019)
US Rates
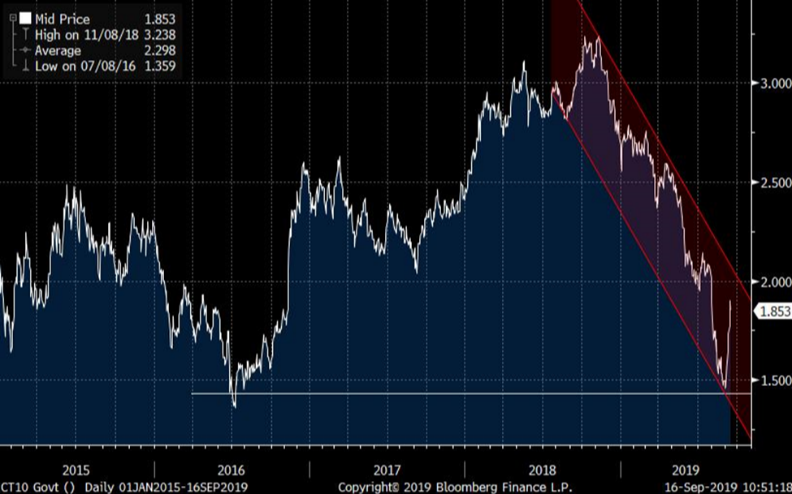
We continue to refer to the mover in US rates as an extraordinary one. And we revert back to a similar disinflationary period from 2015-2016, whereas China was slowing, the Yuan being devalued and US GDP declining in the second half of 2016 with US 10-year rates reaching levels close to 1.35%.
The chart attached below highlights 10-year yields from 2015 through current time, and level. The bottom end of the chart shows similar extreme levels and a clear rejection back in 2016 and again recently within the first few weeks of September. This chart in isolation was not the sole reason for our call for rates to reverse, but certainly an important one as we continued to fail at levels through 1.50 in the month of August.
US Investment Grade Credit
Similar to the discussion around negative rates and the inverted US yield curve, the implications for market pricing across other asset classes (credit) and seemingly mixed economic signals has been part of the discussion as well. We feel strongly that the yield curve and rate level have been impacted by the negative yield story. And certainly, part of the price action in August reflects this. We have not suggested the Fed ignore the yield curve entirely, more so to acknowledge flows are impacting levels.
Although the inverted curve story garners all of the attention, the level of corporate spreads also comes into play when looking at recession indicators. The natural question being, why are spreads tightening if the economy is moving toward a recession? A very logical question for investors to ask.
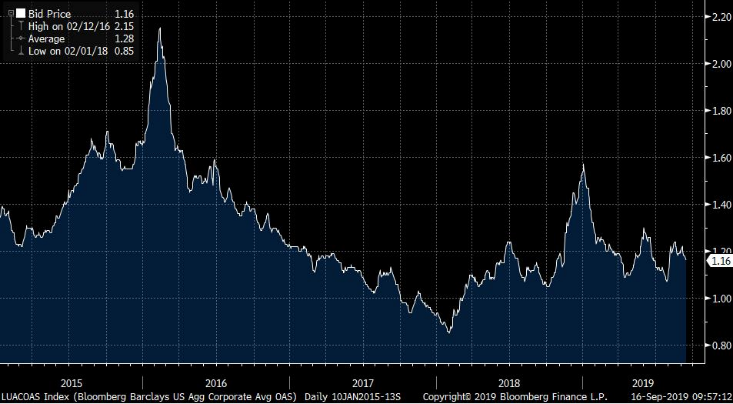
Similar to the inverted yield curve narrative, the answer may not be entirely clear, as the importation of the negative yield affect is also impacting corporate bond spreads. For an apples to apples comparison with US sovereign debt, the below chart is the Bloomberg Barclays US Aggregate Corporate Average Option Adjusted Spread.
Interestingly, and part of the story and opportunity for issuers in 2019, is that reverting back to the 2015-2016 period of time, corporate spread levels were much wider for most of 2016 at the same time US Treasury levels were equal to where we reached recently in 2019. The chart below also shows the extreme period of spread widening in late 2018, and subsequent tightening through the Fed pivot and global central bank liquidity campaign in 2019.
Historic Period of Corporate Issuance
What began as mostly a sovereign story, the negative yield phenomenon is very much a global investment grade credit story. Essentially, the further negative sovereign yields go, the greater the quest for higher, positive yielding assets within proper investment guidelines. So essentially, the same dynamic impacting the overall negative yield pool has worked its way through the global investment grade market with spillover to the United States.
For context, the pool of negative yielding corporate debt surpassed the $1 trillion market in the most recent rate move in August. Similar to the move in sovereign debt, this is up significantly from earlier in the year, as the trade war intensified, economic growth slowed and central banks made a dramatic coordinated pivot.
Now is the Time
As the old saying goes: “feed them while they’re hungry.” Despite the recent backup in US sovereign rates, credit spreads remain very tight. And we believe the importation of the negative yield story abroad is a strong part of the reason.
According to our Head of Investment Grade Credit Trading, Stephen Haas, following the Labor Day holiday there has been a historic barrage of new issues, including 91 borrowers with $117 billion priced across 145 tranches. Although expected to slow, issuance this week is still expected in the range of $35 billion with the money center banks dominating much of the secondary trading over the past week. Additionally, earlier today Lipper reported a $5.6 billion inflow into Investment Grade funds, the third largest on record.
Where Do We Go From Here
The outlook for the global economy remains uncertain. In conjunction with this, over the weekend a clear sign of geopolitical risk was inserted with the attack on Saudi oil fields. Still, with central banks very focused including the ECB’s recent announcement, short-term the market will still have support.
What’s important from here is to strike while the iron is hot. In other words, extreme levels in markets generally don’t last. Similar to the move we had in rates over the past week, and in looking at the year-end charts in Investment Grade credit from 2015 and 2018, reversals in credit do happen and generally with pockets of illiquid markets. The end of 2018 is a prime example.
The Fed will likely deliver another 25-basis point cut this week. Yet, the bar going forward may in fact become more difficult as we close out 2019 with the potential for progress on the trade front. In other words, the same dynamics which created this pocket of very tight spreads and low rates could easily reverse if the trade situation alleviates and the Fed takes a step back.
In the end, this has all been one big trade. From the latter part of last year, through the extreme global central bank pivot and the increasing pool of negative yielding assets. Essentially, the negative yield story in many ways is a negative growth story. As the central banks keep their foot on the gas, coupled with a short-term sentiment shift between the US and China, the potential for current market dynamics to reverse at some point has increased.
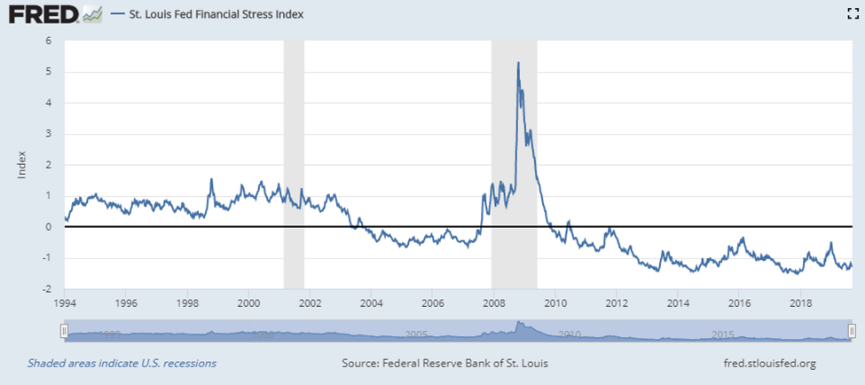
The Fed has spoken at length about the improvement in financial conditions this year. From the fall of 2018 through August of 2019, 10 year nominal yields are close to 200-basis points lower! Fed chairman Powell referred to this specifically when the Fed cut interest rates this past July. Essentially, the market should not view the rate cut in isolation and that much of the improvement has occurred without a cut in rates. And he is right.
Both on the consumer and corporate side, the importation of the negative yield dynamic abroad has offered a very constructive underpinning for overall financing levels in the United States.