April Credit Snapshot


The credit markets in April fell short of monthly expectations, as volatility diminished following the mini banking crisis and we saw wider spreads as the markets began to stabilize.
The new issue calendar came in at $65.7Bln, missing expectations by 35% on expectations of $100Bln. The U.S. Treasury market saw 2’s—10’s close inverted by 62 basis points after beginning the month inverted by 54 basis points and 2’s-30’s inverted by 37 basis points at month end after opening the month inverted by 33 basis points. Spreads were unchanged to 25 basis points wider depending on sector and sub sectors and traded in a 10-45 basis point range on the month.
April saw lighter secondary trading activity as markets stabilized following March’s mid-month bank crisis that saw bank and financial spreads snap wider. On the month, we saw $2.49Bln in net client selling as spreads moved wider.
Concerns remain in the market for the Regional Bank space as First Republic gets acquired by JPMorgan after a weekend where they looked for a partner as the FDIC asked JPMorgan, PNC and U.S. Bancorp for bids for First Republic.
The crisis for now seems contained following earnings in financials however a close eye will remain on the space. Investors have had plenty to cheer this earnings season so far on a broad spectrum with resilient consumer spending, upbeat big tech results and confident economic outlooks from corporate executives.
All eyes will be on the Fed this week and their next move as investors, issuers and traders try to navigate difficult market conditions with spreads closing the month wider and U. S. Treasury rates closing slightly higher.
| Issuance Stats | IG (ex-SSA) Total |
| MTD | $65.7Bln |
| YTD | $460.59Bln (-18% YoY) |
|
Supply Run Rate |
|
| IG Gross (ex-SSA) | YTD |
| 2023 | $460.59Bln |
| 2022 | $560.54Bln |
| 2021 | $547Bln |
IG credit spreads were unchanged to 25 basis points wider and traded in a narrower range for the month (10-45 basis points), than March. Financials were wider again along with the sub-sector of regional banks. The U.S. Treasury market saw 2yr notes higher by +7 basis points, 10yr notes lower by -1 basis point and the 30yr closed the month higher by +3 basis points as we saw less volatility in rates in April.
Looking at U.S. Treasury rates in April we saw the month begin with 2’s — 10’s inverted by 54 basis points and 2’s — 30’s by 33 basis points, closing the month with 2’s — 10’s inverted by 62 basis points and 2’s — 30’s inverted by 37 basis points.
The Fed last raised rates on March 22 by 25 basis points, as many debated if they should be raising rates in the middle of a banking liquidity crisis but just before the issues started with Silicon Valley Bank, there was talk of the Fed raising rates 50 basis points. The Fed will meet this week on Wednesday May 3. They have had plenty of data releases on employment, earnings, and inflation to evaluate their next move.
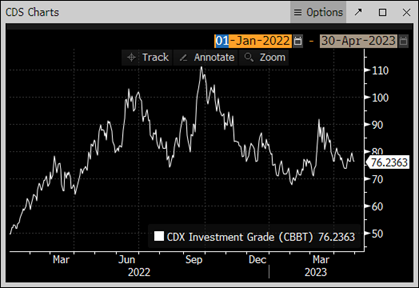
The CDX index started April 2023 at 76.6 and moved to the month high on 4/04/23 at 81.14 and then traded steadily lower into mid-month closing 73.89 on 4/18/23 and then closed the month at 76.23 on 4/28/23.
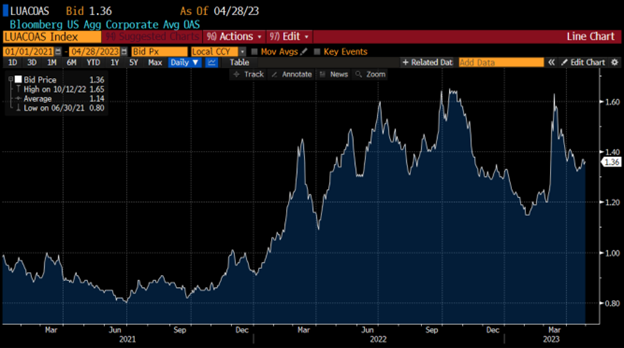
The Bloomberg Barclays U.S. Aggregate Average OAS opened April 2023 at 1.36 and moved to the months high on 4/06/23 at 1.41 and traded lower into 1.32 on 04/18/23 before closing the month at 1.36 on 4/28/23.
See the charts below for more information.
U.S. Treasury Moves
1/31/22 to 4/28/23
| 2yr US Treasury | 10yr US Treasury | 30yr US Treasury | |||
| 1/31/22 | 1.18% | 1/31/22 | 1.79% | 1/31/22 | 2.11% |
| 12/01/22 | 4.25% | 12/01/22 | 3.53% | 12/01/22 | 3.64% |
| 12/15/22 | 4.23% | 12/15/22 | 3.44% | 12/15/22 | 3.48% |
| 12/30/22 | 4.41% | 12/30/22 | 3.88% | 12/30/22 | 3.97% |
| 1/03/23 | 4.40% | 1/03/23 | 3.79% | 1/03/23 | 3.88% |
| 1/17/23 | 4.18% | 1/17/23 | 3.53% | 1/17/23 | 3.64% |
| 1/31/23 | 4.21% | 1/31/23 | 3.52% | 1/31/23 | 3.65% |
| 2/01/23 | 4.09% | 2/01/23 | 3.39% | 2/01/23 | 3.55% |
| 2/13/23 | 4.52% | 2/13/23 | 3.72% | 2/13/23 | 3.79% |
| 2/28/23 | 4.81% | 2/28/23 | 3.93% | 2/28/23 | 3.92% |
| 3/01/23 | 4.89% | 3/01/23 | 4.01% | 3/01/23 | 3.97% |
| 3/15/23 | 3.93% | 3/15/23 | 3.51% | 3/15/23 | 3.70% |
| 3/31/23 | 4.06% | 3/31/23 | 3.48% | 3/31/23 | 3.67% |
| 4/03/23 | 3.97% | 4/03/23 | 3.43% | 4/03/23 | 3.64% |
| 4/14/23 | 4.08% | 4/14/23 | 3.52% | 4/14/23 | 3.74% |
| 4/28/23 | 4.04% | 4/28/23 | 3.42% | 4/28/23 | 3.67% |
CDX Investment Grade Index April 2023

CDX Investment Grade Index April 2023
Bloomberg US Agg Corporate Avg OAS 01/01/21—4/28/23
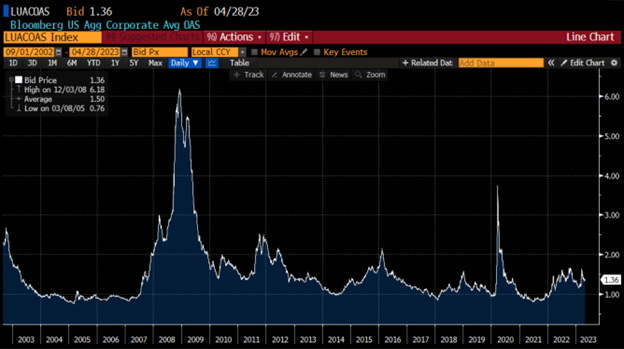
Bloomberg Barclays US Agg Corporate Avg OAS 09/01/02—04/28/23
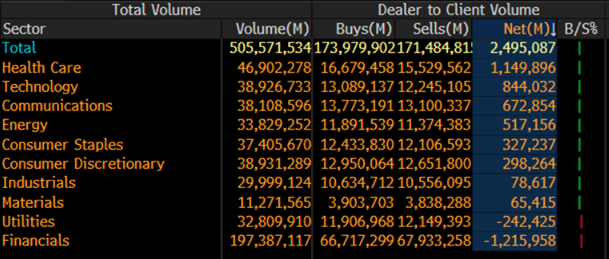
IG credit flows in April came in at $505Bln vs trailing months, March $683Bln, February $617Bln, January $620Bln, December $467Bln, November $566Bln, October $574Bln, and September $576Bln. The trailing six-month average volume is $576 billion.
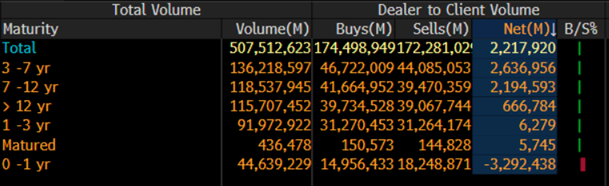
For the second straight month, we saw a light new issue calendar that missed expectations with wider spreads along with net client selling on solid volume. April saw $2.49Bln in net client selling. The 3-7yr and 7-12yr part of the credit curve led the selling with $2.6Bln and $2.1Bln respectively, while 0-1yr paper saw over $3.2Bln of net client buying.
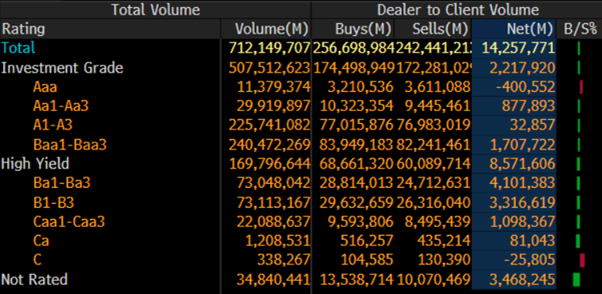
Almost all sectors saw net client selling while Financials saw $1.2Bln of net client buying and Utilities saw $242mm of net client buying. Looking at the markets from a ratings perspective, Baa1-Baa3 paper saw $1.7Bln of net client selling along with Aa1-Aa3 paper that saw $877mm while Aaa paper saw $400mm of net client buying.
See IG credit flow charts below for more information.
April 2023 IG Credit Flows by Sector
April 2023 IG Credit Maturity Flows
April 2023 IG Credit by Investment Grade Ratings
April’s new issue calendar missed monthly expectations by 35%, while the U.S. Treasury curve saw rates move slightly higher and a curve that remains inverted. We saw solid secondary trading flows for the fourth month in a row that led to net client selling, as spreads were wider on lower volatility.
The U.S. Treasury curve saw 2’s 10’s close inverted by 62 basis points and 2’s 30’s inverted by 37 basis points. The Fed was last in play in March and executed a 25-basis point rate hike amidst a mini banking crisis with regional banks taking the spotlight but April saw key economic data releases along with the kickoff of earnings which so far have been decent leaving the Fed set to meet again on May 3. Are we nearing the end of the Fed rate hikes?
The U.S. Federal Reserve has raised rates +400 basis points since March 2022, BOE +415 since Dec 2021 and the ECB +350 since July 2022.
It seems the markets are prepared for a 25-basis point hike from 5%-5.25%, but the key factor the markets will be looking for and reacting to will be: does Fed Chair Powell and colleagues signal a pause?
May will be an action-packed month, frontloaded with the Fed on Wednesday, May 3, unemployment data release on Friday, May 5 and the fallout from the First Republic bank failure/JPMorgan takeover. In addition, the banking sector continues to emerge from the mini banking crisis along with the balance of first quarter earnings and the debt ceiling debate. May is expected to be a busy month with $135Bln of new deals and $30-35Bln is expected for the first week.
Great job by the AmeriVet Securities team in April as we were a Co-Manager on $3.75Bln 11NC10 deal for Wells Fargo, Morgan Stanley’s $3.25Bln 11NC10 tranche and Bank of America’s $8.5Bln two-part deal.
The AmeriVet Securities sales team continues to bring in a large volume of differentiated orders from Tier II and Tier III accounts on new issue deals.