April Credit Snapshot


In April, the credit markets saw a new issue calendar that topped monthly expectations as issuers reported earnings and the treasury curve steepened over the past few months.
Spreads traded in a somewhat volatile range, as volatility in Treasuries along with a robust new issue calendar from the Money Center Banks caused investors to move assets around the curve. Credit spreads in April were 10 basis points tighter to 10 basis points wider with paper trading in 5 to 25 basis point ranges for the month.
The new issue market topped monthly estimates of $100 billion, closing the month at $110.795 billion. Secondary activity in April saw net client buying of over $8.1 billion, that was heavily weighted in financials and consumer discretionary, which accounted for over $5.9 billion in net client buying.
| Issuance Stats | IG (ex-SSA) Total |
| MTD | $110.795 billion |
| YTD | $547.935 billion |
| Supply Run Rate | |
| IG Gross (ex-SSA) | YTD |
| 2021 | $547.4 billion |
| 2020 | $708.4 billion (-23%) |
| 2019 | $399.8 billion (+37%) |
IG Credit spreads were 10 basis points tighter to 10 basis points wider as U.S. Treasury volatility remains in the market. The moves in the U.S. Treasury market are causing investors to move money around the curve and that is driving some volatility in credit spreads.
The 10yr and 30yr Treasuries have traded in some volatile ranges to begin 2021 with the 10yr in 81 basis point range and the 30yr in a +76 basis points range year to date. See below for the 2yr, 10yr and 30yr Treasury levels.
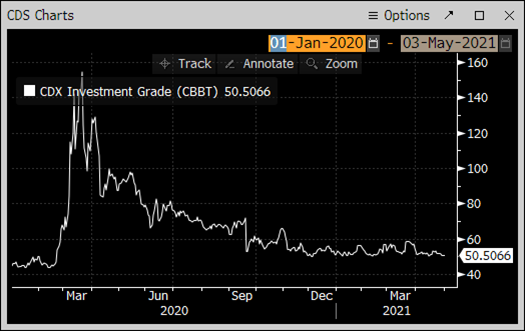
The CDX Investment Grade Index opened the month at 51.43 and traded as tight as 50.5 on April 15, before moving wider on April 20 at 52.9, and closing the month at 50.94. See below for more information.
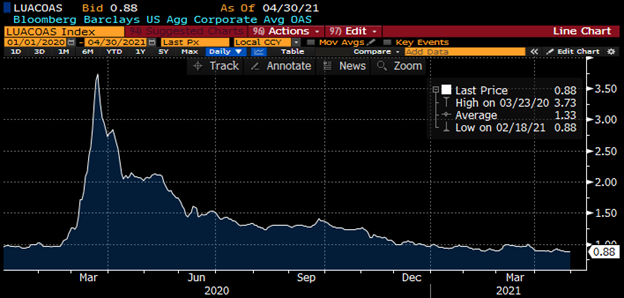
The Bloomberg Barclays U.S. Agg Avg OAS closed out the month at 0.88 and traded in a pretty tight range with the high on April 20 at 0.92. See the charts below for more information.
Treasury Moves from January 4, 2021 to April 30, 2021
| 2yr U.S. Treasury | 10yr U.S. Treasury | 30yr U.S. Treasury | |||
| January 4 | 0.13% | January 4 | 0.93% | January 4 | 1.65% |
| February 1 | 0.09% | February 1 | 1.09% | February 1 | 1.84% |
| March 1 | 0.17% | March 1 | 1.45% | March 1 | 2.23% |
| March 31 | 0.16% | March 31 | 1.74% | March 31 | 2.41% |
| April 1 | 0.17% | April 1 | 1.69% | April 1 | 2.34% |
| April 15 | 0.16% | April 15 | 1.56% | April 15 | 2.23% |
| April 30 | 0.16% | April 30 | 1.65% | April 30 | 2.30% |
CDX Investment Grade Index
![]()
CDX Investment Grade Index
Bloomberg Barclays U.S. Agg Corporate Avg OAS
IG credit flows for the month were on the lighter side and came in at $499 billion below the robust levels in March of $641 billion, February’s $512 billion and January’s $525 billion.
The trailing six-month avg volume is $508 billion.
April’s strong new issue calendar along with volatility in credit spreads and U.S Treasuries gave way to lighter secondary volume, as we saw investors and portfolio managers moving paper around the credit curve for the second month in a row.
After the strong earnings reports from the Money Center Banks followed by the remainder of sectors in the market spreads stabilized towards the end of the month after a flurry of new issue deals in the middle of April.
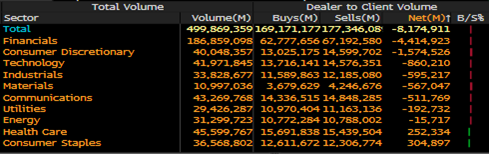
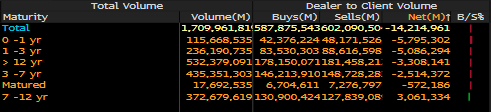
While volume was on the lighter side, we did see very strong demand for secondary paper that resulted in solid net client buying. Financials lead the charge with $4.4 billion in net client buying, followed by Consumer Discretionary of over $1.5 billion.
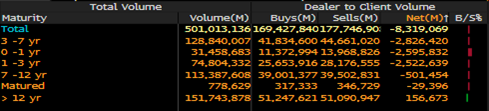
The real story continues to be clients moving money around the credit curve as we saw over $2.8 billion in net client buying in 3-7yr maturities, 2.5 billion in 0-1yr maturities and $2.5 billion 1-3yr maturities, while 7-12yr saw just $501 million in net client buying and in the back end of the curve 12-30yr saw net client selling of $156 million.
When looking at the trailing four months back to January 1, 2021, investors have been plowing money into 0-3yr maturities with over $10.7 billion in net client buying, while we saw a bit of a reversal in the back end of the credit curve that saw some net client selling.
The 7-12yr part of the curve has been struggling with the U.S. treasury steepening trade that has seen just over $3 billion in net client selling. See the IG Credit Flow chart below for more information.
April IG Credit Flows
April IG Credit Maturity Flows
Trailing 4 Months IG Credit Maturity Flows 1/01/21—4/30/21
April saw a new issue calendar that topped monthly expectations, lighter secondary trading flows, choppy spreads that saw wide ranges and a rally in spreads into the month’s end.
The steepening in the U.S. Treasury curve continues to have the credit market on notice and investors are definitely making moves along the curve based on the move in rates.
We are expecting $35 billion for the first week of May in new issue credit with a total of $150 billion for the month. The primary and secondary credit markets in May are beginning with spreads just a few basis points away from post-credit crisis lows and funding costs for companies remain very attractive.
I want to close by congratulating the AmeriVet Securities team on a great job in the month of April, as we were Co-Managers on deals from JPMorgan, Morgan Stanley, Citigroup, Brighthouse Financial and News Corp, as well as three Structured Products deals from JPMorgan-JPMT 2021-6, Morgan Stanley-Capital I Trust-2021-L5 and Ginnie Mae.
The AmeriVet Securities sales team continues to bring in large volumes of differentiated orders from Tier II and Tier III accounts on new issue Co-Managed deals