October Credit Snapshot


The credit markets in October narrowly missed expectations and came in at $81.75Bln missing expectations of $85Bln. The U.S. Treasury market saw 2’s—10’s close inverted by just 15 basis points while 2’s-30’s reversed and are no longer inverted now steep by 1 basis point. Spreads were mixed from tighter by -5 basis points to +25 basis points wider and traded in a 15-40 basis point range. October saw solid secondary trading activity, but the real story was a reversal mid-month from heavy net client buying to the month that closed with just $909mm of Net Client Buying as markets had to contend with UAW strikes, War in the Middle East and a U.S. Treasury market that saw heavy volatility and violent inter-day swings causing pain in the fixed income markets. The Fed is expected to pause on November 1 but ultimately, they are going to have to deal with swelling government debt issuance.
| ISSUANCE STATS | IG (ex-SSA) Total |
| MTD | $81.75Bln |
| YTD | $1,063.624Bln (-1% YoY) |
Supply Run Rate
| IG Gross (ex-SSA) | YTD |
| 2023 | $1,063.624Bln |
| 2022 | $1,075Bln |
| 2021 | $1,237Bln |
IG credit spreads in October were mixed from -5 basis points tighter to +25 basis points wider as volatility surged on the month and spreads traded in a 15-40 basis point range. The US Treasury market saw 2yr notes lower by -4 basis points, 10yr notes higher by +24 basis points and the 30yr closed the month +28 basis points higher. Looking at U.S. Treasury rates in October, we saw the month begin with 2’s — 10’s inverted by 43 basis points and 2’s — 30’s by 31 basis points, closing the month with 2’s — 10’s inverted by 15 basis points and 2’s — 30’s steep by just 1 basis points. The Fed paused at last meeting in September but has still raised rates 500+ basis points since March of 2022 and are expected to pause again on 11/1.
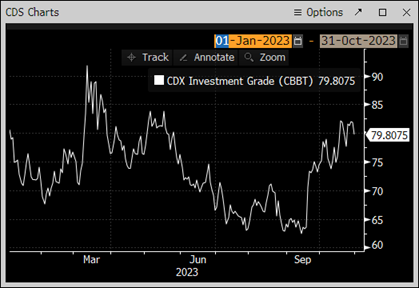
The Fed has had plenty of unemployment data, along with key CPI and PPI reports, and third quarter earnings and now must contend with war in middle east. The CDX index opened October ’23 at 75.1 and traded in a tight range until early in the month hitting the month low of 73.7 on 10/11/23, and then mid-month volatility spiked sending the index to the months high of 82.1 on 10/19/23 and was range bound near the high through month end closing tighter at 79.8 on 10/31/23. The avg spread for the month was 78.3.
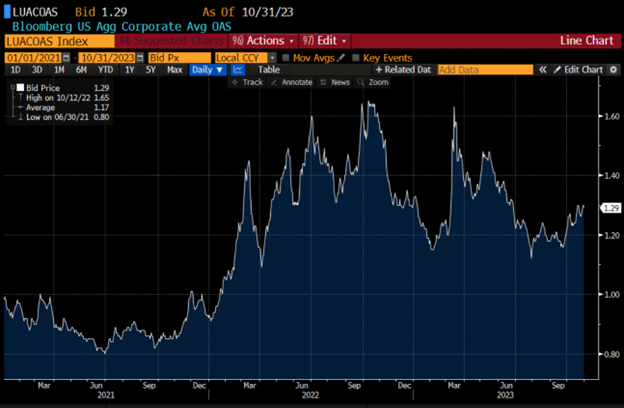
The Bloomberg Barclays U.S. Aggregate Average OAS opened October 23’ at 1.23 and traded higher hitting 1.27 on 10/05/23 and then moved back to months low of 1.23 mid-month before spiking to the months high of 1.30 on 10/20/23 and closed the month at 1.29. The average spread for the month was +1.26.
See charts below for more information.
Treasury Moves from 12/01/22 to 10/31/23.
| 2yr US Treasury | 10yr US Treasury | 30yr US Treasury | |||
| 12/01/22 | 4.25% | 12/01/22 | 3.53% | 12/01/22 | 3.64% |
| 12/15/22 | 4.23% | 12/15/22 | 3.44% | 12/15/22 | 3.48% |
| 12/30/22 | 4.41% | 12/30/22 | 3.88% | 12/30/22 | 3.97% |
| 1/03/23 | 4.40% | 1/03/23 | 3.79% | 1/03/23 | 3.88% |
| 1/17/23 | 4.18% | 1/17/23 | 3.53% | 1/17/23 | 3.64% |
| 1/31/23 | 4.21% | 1/31/23 | 3.52% | 1/31/23 | 3.65% |
| 2/01/23 | 4.09% | 2/01/23 | 3.39% | 2/01/23 | 3.55% |
| 2/13/23 | 4.52% | 2/13/23 | 3.72% | 2/13/23 | 3.79% |
| 2/28/23 | 4.81% | 2/28/23 | 3.93% | 1/31/23 | 3.65% |
| 3/01/23 | 4.89% | 3/01/23 | 4.01% | 3/01/23 | 3.97% |
| 3/15/23 | 3.93% | 3/15/23 | 3.51% | 3/15/23 | 3.70% |
| 3/31/23 | 4.06% | 3/31/23 | 3.48% | 3/31/23 | 3.67% |
| 4/03/23 | 3.97% | 4/03/23 | 3.43% | 4/03/23 | 3.64% |
| 4/14/23 | 4.08% | 4/14/23 | 3.52% | 4/14/23 | 3.74% |
| 4/28/23 | 4.04% | 4/28/23 | 3.42% | 4/28/23 | 3.67% |
| 5/01/23 | 4.14% | 5/01/23 | 3.50% | 5/01/23 | 3.84% |
| 5/15/23 | 3.99% | 5/15/23 | 3.50% | 5/15/23 | 3.84% |
| 5/31/23 | 4.39% | 5/31/23 | 3.63% | 5/31/23 | 3.84% |
| 6/01/23 | 4.33% | 6/01/23 | 3.61% | 6/01/23 | 3.84% |
| 6/15/23 | 4.62% | 6/15/23 | 3.72% | 6/15/23 | 3.85% |
| 6/30/23 | 4.89% | 6/30/23 | 3.83% | 6/30/23 | 3.86% |
| 7/03/23 | 4.94% | 7/03/23 | 3.86% | 7/03/23 | 3.87% |
| 7/14/23 | 4.74% | 7/14/23 | 3.83% | 7/14/23 | 3.90% |
| 7/31/23 | 4.87% | 7/31/23 | 3.95% | 7/31/23 | 4.01% |
| 8/01/23 | 4.92% | 8/01/23 | 4.05% | 8/01/23 | 4.11% |
| 8/15/23 | 4.92% | 8/15/23 | 4.21% | 8/15/23 | 4.32% |
| 8/31/23 | 4.86% | 8/31/23 | 4.10% | 8/31/23 | 4.21% |
| 9/01/23 | 4.87% | 9/01/23 | 4.18% | 9/01/23 | 4.29% |
| 9/15/23 | 5.02% | 9/15/23 | 4.33% | 9/15/23 | 4.42% |
| 9/29/23 | 5.04% | 9/29/23 | 4.57% | 9/29/23 | 4.69% |
| 10/02/23 | 5.12% | 10/02/23 | 4.69% | 10/02/23 | 4.81% |
| 10/16/23 | 5.09% | 10/16/23 | 4.71% | 10/16/23 | 4.87% |
| 10/31/23 | 5.08% | 10/31/23 | 4.93% | 10/31/23 | 5.09% |
CDX Investment Grade Index October 2023

CDX Investment Grade Index October 2023
Bloomberg US Agg Corporate Avg OAS 01/01/21—10/31/23
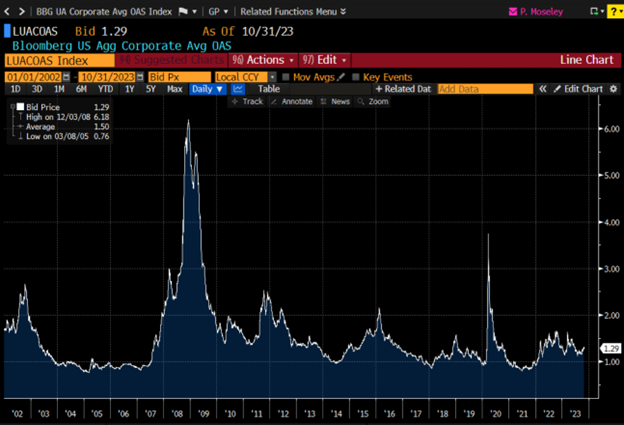
Bloomberg Barclays US Agg Corporate Avg OAS 01/01/02—10/31/23
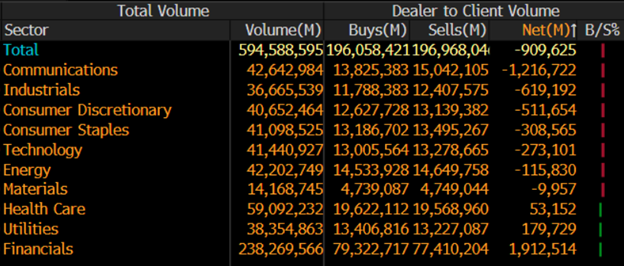
IG credit flows in October came in at $594Bln vs trailing months, September $522Bln, August $551Bln, July $517Bln, June $577Bln, May $619Bln, April $505Bln, March $683Bln, February $617Bln, January $620Bln. The trailing six-month average volume is $563Bln.
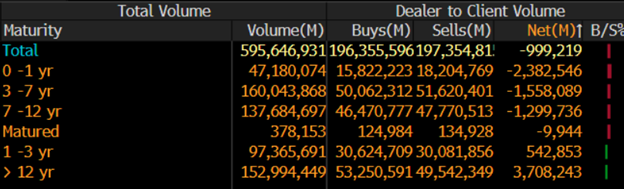
Spreads were mixed in October from -5 basis points tighter to +25 basis points wider as volatility has reared its head and created a lot of uncertainty in the markets as absolute yields while at very attractive levels that we have not seen for a long period of time the path to these levels has created a tough environment for all investors. October saw $909mm of net client buying on the back up in spreads and higher all-in yields. However, the last 2 weeks of the month paint a different picture with heightened volatility due to war in the Middle East that caused heavy selling in credit of over $6.3Bln from 10/17/23—10/31/23 that reversed mid-month gains of net client buying to the tune of $7.2Bln from 10/01/23—10/16/23. The 12yr and longer and 1-3yr parts of the credit curve led the selling with $4.25Bln, while 0-1yr, 3-7yr and 7-12yr paper saw over $5.24Bln of net client buying, respectively.
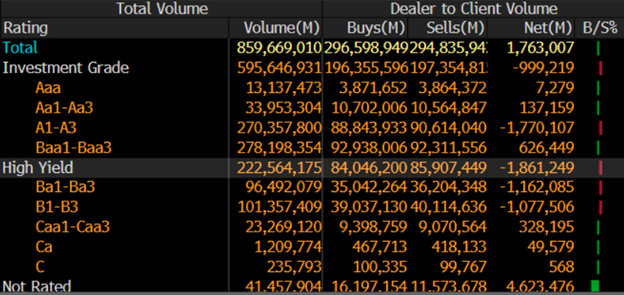
Financials, utilities and health care lead the charge in net client selling while communications, industrials and consumer discretionary saw most of the net client buying. Looking at the markets from a ratings perspective, A1/A3 paper saw net client buying of $1.77Bln with all other investment grade ratings seeing net client selling.
See IG Credit Flow charts below for more information.
October 2023 IG Credit Flows by Sector
October 2023 IG Credit Maturity Flows
October 2023 IG Credit by Investment Grade Ratings
October’s new issue calendar narrowly topped monthly expectations and we saw solid secondary trading flows along with heavy net client selling into the month end, although the month ended with just over $909mm of net client buying.
We saw another solid move higher for the long end of U.S. Treasury yields along with generally wider credit spreads. The U.S. Treasury curve saw 2’s 10’s close inverted by 15 basis points and 2’s 30’s, now steep by 1 basis point no longer inverted.
As we begin the month of November, investors turn their attention to the Fed Meeting on November 1 along with Friday’s unemployment data, key CPI and PPI reports, and the continued war and fighting in the Middle East. Interesting that we have not seen a sustained flight to quality trade due to war in the Middle East. The effects of a zero-interest rate policy and free money over a 15-year period, followed by a rapid rate hike environment continue to be weighing on the U.S. consumer and the economy and investors. November’s new issue calendar is calling for $80-100Bln for the month.
Great job by the AmeriVet Securities team in September as we were a Co-Manager on $1Bln deal for US Bancorp, Co-Manager on $2Bln two-part deal for Bank of New York, Co-Manager on $7.25Bln three-part deal for JPMorgan and Co-Manager on $1Bln Santander – SNBA Auto Lease Trust 2023-A.
The AmeriVet Securities sales team continues to bring in a large volume of differentiated orders from Tier II and Tier III accounts on new issue deals.