December Credit Snapshot


The credit markets in December saw a new issue calendar that barely registered and came in below expectations with mixed spreads and U.S. Treasury rates that pushed higher into year end.
Supply came in at $7.25 billion, missing expectations of $20 billion. The U.S. Treasury market saw 2’s—10’s close inverted by 53 basis points and 2’s-30’s inverted by 44 basis points at month end. Spreads were mixed on the month and were 10 basis points tighter to 10 basis points wider and traded in a 10-25 basis point range.
December saw light secondary trading activity and a reversal of the 5-month trend as we saw $4.6 billion in net client buying on higher U.S. Treasury rates. We had seen a strong trend as November marked the 5th straight month of net client selling (7/01/22—11/30/22 $39.8 billion net client selling) but December reversed that trend.
The markets saw much lighter volatility in December as the much-anticipated Fed meeting and 50 basis point rate hike ended up giving way to higher U.S. Treasury yields and month-end/year end buying of credit.
|
ISSUANCE STATS |
IG (ex-SSA) Total |
| MTD | $7.25 billion |
| YTD | $1,184.2 billion |
Supply Run Rate
|
IG Gross (ex-SSA) |
YTD |
| 2022 | $1,184.2 billion (-16%) |
| 2021 | $1,410.706 billion |
| 2020 | $1,748 billion |
| 2019 | $1,108.2 billion |
IG credit spreads in December were mixed from 10 basis points tighter to 10 basis points wider and traded in a much tighter range for the month (10-25 bps) than we had been seeing in previous months.
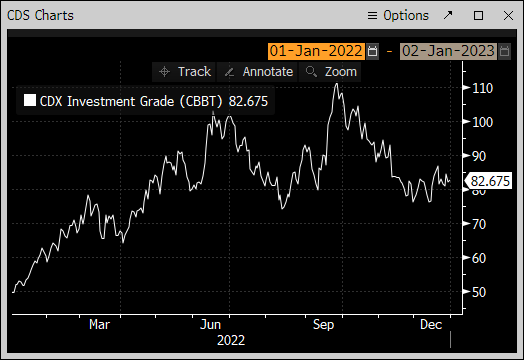
The U.S. Treasury market saw 2yr notes higher by +16 basis points, 10yr notes higher by +35 basis points and the 30yr closing the month higher by +33 basis points. Looking at U.S. Treasury rates in December, we saw the month begin with 2’s — 10’s inverted by 72 basis points and 2’s — 30’s by 61 basis points, closing the month with 2’s — 10’s inverted by 53 basis points and 2’s — 30’s inverted by 44 basis points. The Fed raised rates on 12/14 50 bps. Clearly, the defining economic event in 2022 was Fed Chair Powell, as he rapidly deployed rate hikes to combat inflation. Most recently the Fed has signaled smaller rate hikes, amid hopes for a soft landing to try and avoid a full-blown recession. The CDX index started December ‘22 at 77.77 and traded in a tight range until rising to 86.82 on 12/20/22 and then traded slightly lower into month end closing at 82.675.
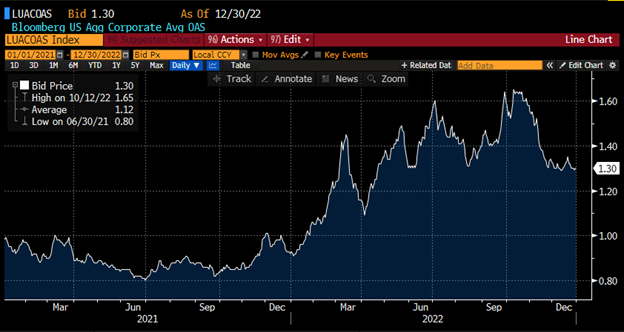
The Bloomberg Barclays U.S. Aggregate Average OAS opened December 22’ at 1.32 and traded in a tight range before moving higher to 1.35 on 12/20/22 an then made its way to the lowest levels of the month on 12/29/22 at 1.29 before closing the month slightly wider at 1.30 on 12/30/22.
U.S. Treasury Moves
December 31, 2021 – December 30, 2022
| 2yr U.S. Treasury | 10yr U.S. Treasury | 30yr U.S. Treasury | |||
| December 31 | 0.73% | December 31 | 1.52% | December 31 | 1.90% |
| January 3 | 0.78% | January 3 | 1.63% | January 3 | 2.01% |
| January 18 | 1.06% | January 18 | 1.87% | January 18 | 2.18% |
| January 31 | 1.18% | January 31 | 1.79% | January 31 | 2.11% |
| February 1 | 1.18% | February 1 | 1.81% | February 1 | 2.19% |
| February 15 | 1.58% | February 15 | 2.05% | February 15 | 2.37% |
| February 28 | 1.46% | February 28 | 1.86% | February 28 | 2.19% |
| March 1 | 1.31% | March 1 | 1.72% | March 1 | 2.11% |
| March 15 | 1.85% | March 15 | 2.15% | March 15 | 2.49% |
| March 31 | 2.28% | March 31 | 2.32% | March 31 | 2.44% |
| April 1 | 2.44% | April 1 | 2.40% | April 1 | 2.44% |
| April 14 | 2.47% | April 14 | 2.66% | April 14 | 2.92% |
| April 29 | 2.70% | April 29 | 2.85% | April 29 | 2.96% |
| May 2 | 2.73% | May 2 | 2.99% | May 2 | 3.07% |
| May 16 | 2.58% | May 16 | 2.88% | May 16 | 3.09% |
| May 31 | 2.53% | May 31 | 2.85% | May 31 | 3.07% |
| June 1 | 2.66% | June 1 | 2.87% | June 1 | 3.09% |
| June 15 | 3.20% | June 15 | 3.39% | June 15 | 3.39% |
| June 30 | 2.95% | June 30 | 2.97% | June 30 | 3.18% |
| July 1 | 2.84% | July 1 | 2.88% | July 1 | 3.11% |
| July 15 | 3.13% | July 15 | 2.93% | July 15 | 3.10% |
| July 29 | 2.88% | July 29 | 2.64% | July 29 | 3.01% |
| August 1 | 2.90% | August 1 | 2.60% | August 1 | 2.92% |
| August 15 | 3.20% | August 15 | 2.79% | August 15 | 3.10% |
| August 31 | 3.49% | August 31 | 3.19% | August 31 | 3.29% |
| September 1 | 3.51% | September 1 | 3.21% | September 1 | 3.37% |
| September 15 | 3.87% | September 15 | 3.46% | September 15 | 3.48% |
| September 30 | 4.22% | September 30 | 3.80% | September 30 | 3.79% |
| October 3 | 4.12% | October 3 | 3.67% | October 3 | 3.73% |
| October 14 | 4.48% | October 14 | 4.00% | October 14 | 3.99% |
| October 31 | 4.48% | October 31 | 4.04% | October 31 | 4.15% |
| November 1 | 4.54% | November 1 | 4.07% | November 1 | 4.14% |
| November 15 | 4.37% | November 15 | 3.80% | November 15 | 3.98% |
| November 30 | 4.38% | November 30 | 3.68% | November 30 | 3.80% |
| December 1 | 4.25% | December 1 | 3.53% | December 1 | 3.64% |
| December 15 | 4.23% | December 15 | 3.44% | December 15 | 3.48% |
| December 30 | 4.41% | December 30 | 3.88% | December 30 | 3.97% |
CDX Investment Grade Index
December 2022

CDX Investment Grade Index
December 2022
Bloomberg Barclays U.S. Aggregate Corporate Average OAS
January 1, 2021 – December 30, 2022
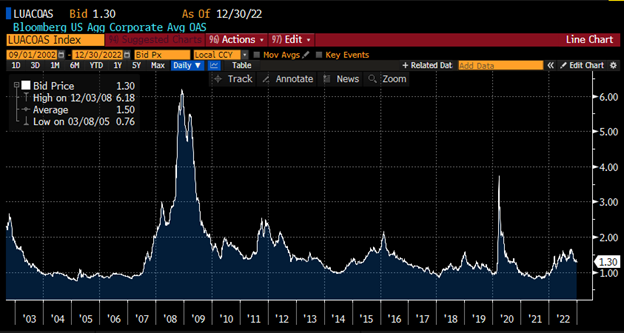
Bloomberg Barclays U.S. Aggregate Corporate Average OAS
September 1, 2002 – December 30, 2022
IG credit flows in the month of December came in on the lighter side at $467 billion vs trailing months, November $566 billion, October $574 billion, September $576 billion, August $536 billion, July $459 billion, June $550 billion, May $549 billion, April $541 billion, March $630 billion, February $489 billion, and January $483 billion. The trailing six-month average volume is $529 billion.
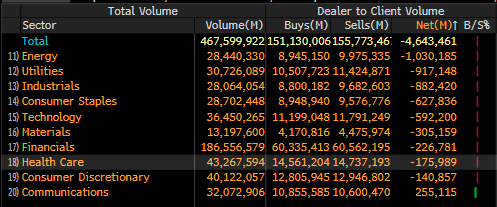
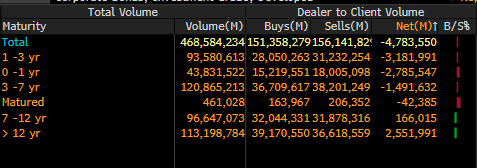
December saw a super light new issue calendar that came in well below expectations and mixed spreads along with solid net client buying into year end. December saw $4.6 billion in net client buying. The 7-12yr and 12-30yr part of the credit curve saw the only net client selling with 7-12yr paper seeing $166 million in selling and 12yr and longer saw over $2.5 billion in net client selling.
The front end of the curve dominated the net client buying with over $7.4 billion; 1-3yr ($3.1 billion), 0-1yr ($2.7 billion) and 3-7yr ($1.4 billion). All sectors saw net client buying with Energy seeing $1.03 billion, Utilities $917 million, Industrials $882 million, and Consumer Staples $627 million while Communications was the exception that saw $255 million of net client selling.
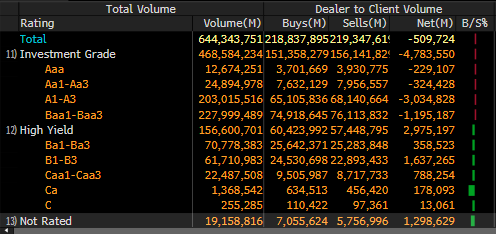
Looking at the markets from a ratings perspective, Baa1/Baa3 paper saw $1.1 billion of net client buying along with A1/A3 paper seeing $3.03 billion and Aa1/Aa3 paper saw net client buying of $324 million and Aaa paper saw $229 million.
See IG Credit Flow charts below for more information.
IG Credit Flows by Sector
December 2022
IG Credit Maturity Flows
December 2022
IG Credit by Investment Grade Ratings
December 2022
December’s new issue calendar fell shy of monthly expectations while the U.S. Treasury curve saw rising rates and a curve that became less inverted with absolute yields higher. We saw light secondary trading flows for the month that lead to net client buying into yearend as spreads were mixed. The U.S. Treasury curve saw 2’s 10’s close inverted by 53 bps and 2’s 30’s close inverted by 44 bps.
The year for credit was clearly dominated by the Fed rate hikes considering 2yr U.S Treasury yields were higher on the year by +368 basis points, the 10yr higher by +236 basis points and the 30yr higher by +207 basis points. December issuance was the slowest in the last 15yrs with the previous low issuance in December of 2018 when sales were just over $8.5 billion.
The new issue market in 2022 was challenging for issuers and syndicate desks as they had to navigate windows of opportunity to issue new debt as the market was full of challenges from execution, timing and difficult funding costs to Go-No-Go calls that were held weekly, while some deals saw enormous book orders, other deals struggled and we saw some deals price at initial price talk and in some cases wider than IPT.
As we look to January and the new year the Fed will meet on February 1, 2023, with another potential 50 basis point rate hike anticipated. We enter the new year with all eyes on the next Fed move (expected to be a slower hiking of U.S. rates), earnings and recession fears and their impact on the credit markets, spread trends, overall funding costs, M&A activity that is expected to rebound and hopefully boost issuance volumes and key economic data beginning with Friday’s unemployment number release.
January new issue projections are coming in at $40 billion for the first week of 2023 and $130 billion for the month of January with expectations for 2023 coming in at $1.15 trillion to $1.35 trillion in line with the $1.184 trillion sold in 2022.
Great job by the AmeriVet Securities team in December as we were a Co-Manager $681.26 million Ally Auto Receivables Trust (ALLYA) 2022-3 deal. The AmeriVet Securities sales team excelled in 2022 bringing in large volumes of differentiated orders from Tier II and Tier III accounts, on all the new issue deals we were involved in.