February Credit Snapshot

The Credit markets in February crushed expectations, pricing $197.975 billion on projections of $150 billion and set a new February record. The previous record for February issuance was $150.9 billion, set in 2023. The U.S. Treasury market saw 2’s—10’s close inverted by 39 basis points, while 2’s-30’s closed inverted by 26 basis points. Spreads were +5 wider to 25 basis points tighter and traded in a 10- 35 basis point range. February saw massive secondary trading activity as the record setting new issue calendar had investors selling secondary paper to fund the new issue calendar, for the second straight month.
After a start to the new year with the Fed supercharging risk assets and pushing spreads tighter and yields lower, they have now begun walking back comments that have shifted the start date for rate cuts, moved U.S. Treasury rates higher, and thrown a monkey wrench into risk assets. The month saw $7.5 billion of Net Client selling as markets closed the month, however, as we began the month, we saw solid net client buying until 2/14/24 when the Fed started talking back the market that was at the time anticipating a rate cut in March.
As these dynamics changed in the market, we saw U.S. Treasuries rise and a heavy dose of net client selling, along with generally tighter credit spreads. The rally in spreads has been a welcome sign for issuers as it has created a solid backdrop for new deals and lower borrowing costs to begin the year as we saw record setting January and February new issue calendars.
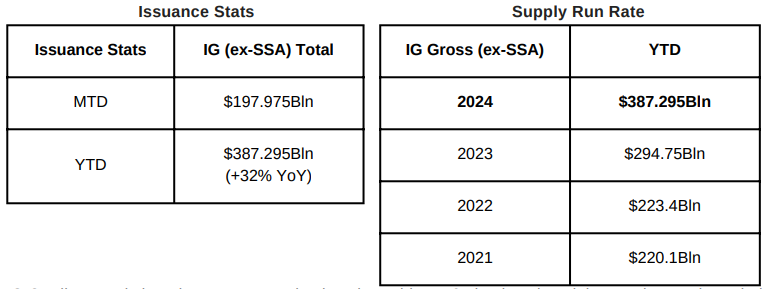
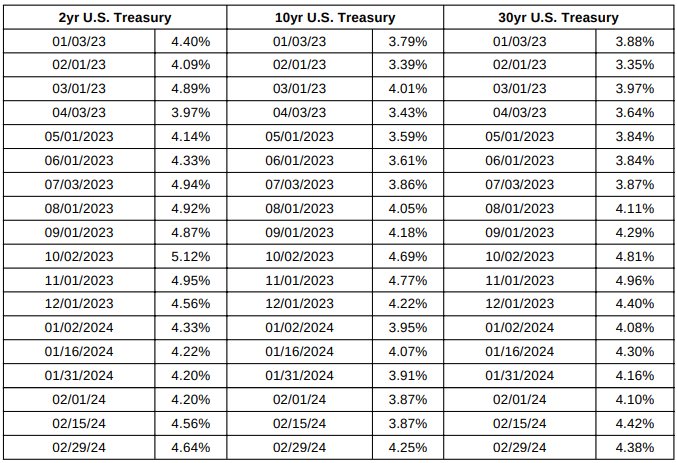
IG Credit spreads in February were +5 basis points wider to 25 basis points tighter and spreads traded in a 10-35 basis point range. The US Treasury market saw 2yr notes higher by 44 basis points, 10yr notes higher by +38 basis points and the 30yr closed the month +28 basis points higher. Looking at U.S. Treasury rates in February we saw the month begin with 2’s — 10’s inverted by 33 basis points and 2’s — 30’s inverted by 10 basis points, closing the month with 2’s — 10’s inverted by 39 basis points and 2’s — 30’s inverted by 26 basis points.
As we look at the markets, the Fed has walked back comments on rate cuts and timing, which has spooked the market and rates reacted very quickly to this information and it played out throughout the U.S. Treasury yield curve.
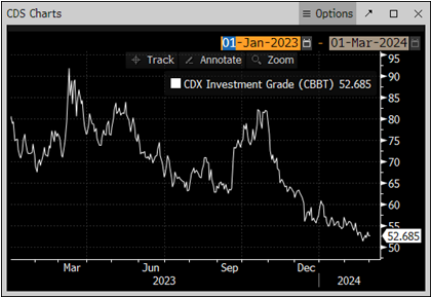
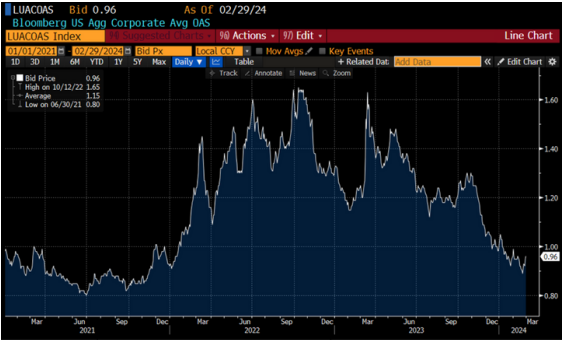
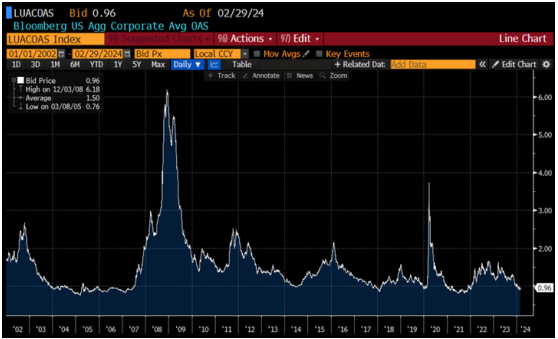
The CDX index opened February ’24 at 55.70 and briefly traded higher to 60.78 before moving lower mid-month as spreads moved tighter with the CDX Index hitting 54.71 on 1/11/24, 55.92 2/06/24 and 55.57 2/13/24 before steadily trading lower to 51.33 on 2/22/24 before closing the month at 53.31 on 2/29/24. The Bloomberg Barclays US Agg Avg Oas opened February 24’ at .99 the MTD high and steadily traded lower to .89 on 2/22/24 before moving higher to close the month at .96 on 2/29/24. The avg spread for the month was +94. The Bloomberg Barclays US Agg Oas began January 23’ at 1.32.
U.S. Treasury Moves
01/31/23 to 02/29/24
CDX Investment Grade Index
February 2024

CDX Investment Grade Index
February 2024
Bloomberg US Agg Corporate Avg OAS
01/01/21–2/29/24
Bloomberg Barclays US Agg Corporate Avg OAS
01/01/02–2/29/24
IG credit flows in February came in at $717 billion vs trailing months, January $742 billion, December $541 billion, November $632 billion, October $594 billion, September $522 billion, August $551 billion, July $517 billion, June $577 billion, May $619 billion, April $505 billion, March $683 billion, February $617 billion, January $620 billion. The trailing 6-month avg volume is $624 billion.
Spreads were mixed from +5 basis points wider to 25 basis points tighter in February, as the massive new issue calendar along with higher rates pushed credit generally tighter. February saw $7.5 billion of net client selling as investors sold secondary paper to buy the new issue calendar.
The real story in the month on secondary paper was from 2/1/24 to 2/14/24, we saw $6.8 billion in net client buying and as the Fed started walking back rate cut timing the second half of the month from 2/15/24 to 2/29/24 saw $14.4 billion of net client selling.
On the credit curve for the month, 12yr and longer maturities led the selling with over $6.7Bln, while 3-7yr and 7-12yr paper saw $1.3 billion & $602 million of net client selling, respectively. Net client buying was seen by 0-1yr paper with $1 billion and 1-3yr paper with $234 million.
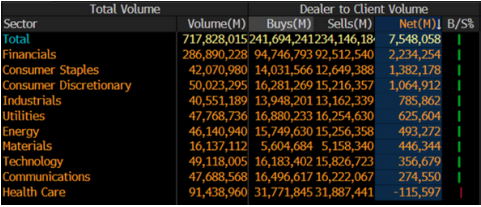
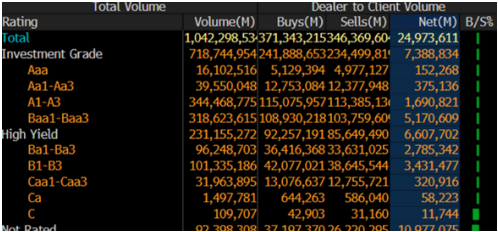
Financials, Consumer Staples, and Consumer Discretionary led the charge in net client selling with just Health Care seeing light net client buying. Looking at the markets from a ratings perspective, Baa1/Baa3 paper saw the lion share of net client selling with $5.1 billion, A1/A3 paper saw $1.6 billion, Aa1-Aa3 $375 million and Aaa saw $152 million.
IG Credit Flows by Sector
February 2024
IG Credit Maturity Flows
February 2024

IG Credit by Investment Grade Ratings
February 2024
February’s new issue calendar saw a massive month of new deals as secondary trading flows followed suit, leading to heavy net client selling. We saw spiking yields across the curve of U.S. Treasuries along with generally tighter spreads. The U.S. Treasury curve saw 2’s 10’s close inverted by 39 basis points and 2’s 30’s closed inverted by 26 basis points. We closed the month with a Fed policy change, no more rate hikes, and spread’s reaction to easing credit conditions has led to solid backdrop for new issue market.
As we begin the month of March, we will get Unemployment data on Friday, upcoming key CPI and PPI reports, SOTU for the President and the next Fed meeting is set for 3/20/24. The markets for the second month in a row are digesting news on New York Community Bancorp’s decisions to name a new CEO following an internal controls issue sending the stock plunging down -64% on the year. We have not seen moves like this since the collapse of Silicon Valley Bank last March 2023.
Over the past 4 months we have seen risk premiums on U. S. investment grade credit narrowing to the tightest levels in over 2 years, on expectations that the Fed has reached the top of the Fed-tightening cycle but as the Fed started walking back rate cut timing mid-month February, we saw spreads slow the months tightening and we saw heavy net client selling to close the month. The new issue calendar is calling for $130 billion for the month of March and next week $30 billion of new supply is expected. Forecast for 2024 are calling for $1.2 trillion to $1.35 trillion.
Great job by the AmeriVet Securities team in February as we were a Joint Lead-Manager on $1.5Bln 15NC10 tranche for Morgan Stanley, Co-Manager on 1Bln 4NC3 tranche for Deutsche Bank NY, Junior Co-Manager on $3Bln 6NC5 tranche for Citigroup, Co-Manager on $550mm 5yr deal for Mondelez, Co-Manager on $1.5Bln 2-part deal for Mizuho, Co-Manager on $1.4Bln 2-part deal for Georgia Power, Co-Manager on $1.5Bln 2-part deal for HSBC USA, Co-Manager on $2.75Bln 2-part deal for HSBC Holding PLC and Co-Manager on $675mm 2-part deal for Potomac Electric Power Co.
The AmeriVet Securities sales team continues to bring in a large volume of differentiated orders from Tier II & Tier III accounts on new issue deals.


