January Credit Snapshot


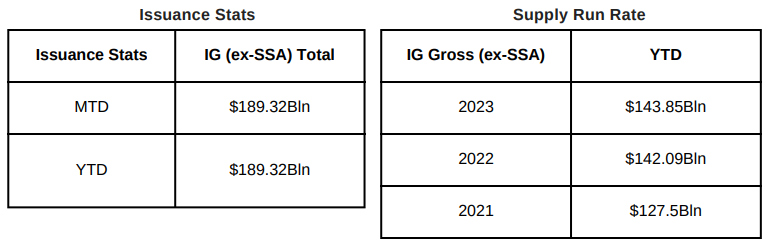
The Credit markets in January shattered expectations, pricing $189.32 billion on projections of $160 billion & set a new January record. The previous record for January issuance was $175 billion set in 2017. The U.S. Treasury market saw 2’s—10’s close inverted by 29 basis points, while 2’s-30’s closed inverted by 4-basis point. Spreads were tighter across the board by 5-to-25 basis points and traded in a 10-45 basis point range.
January saw massive secondary trading activity as the record setting new issue calendar had investors selling secondary paper to fund the new issue calendar. The Fed has super-charged risk assets and pushed spreads tighter and yields lower with a change in stance and consecutive months of “Pause” to rate hikes. The month saw $11 billion of Net Client selling as markets closed with the Fed meeting on 1/31/24 and saw a U.S. Treasury rally bringing down yields and tighter credit spreads.
The Fed has changed from a tightening bias and rate hikes to the potential for rate cuts down the road as the data allows them to move rates lower. The rally in spreads and U.S. Treasuries over the last 3 months has been a welcome sign for issuers as it has created a solid backdrop for new deals and lower all-in borrowing costs to begin the year and that was evident with a record setting January new issue calendar.
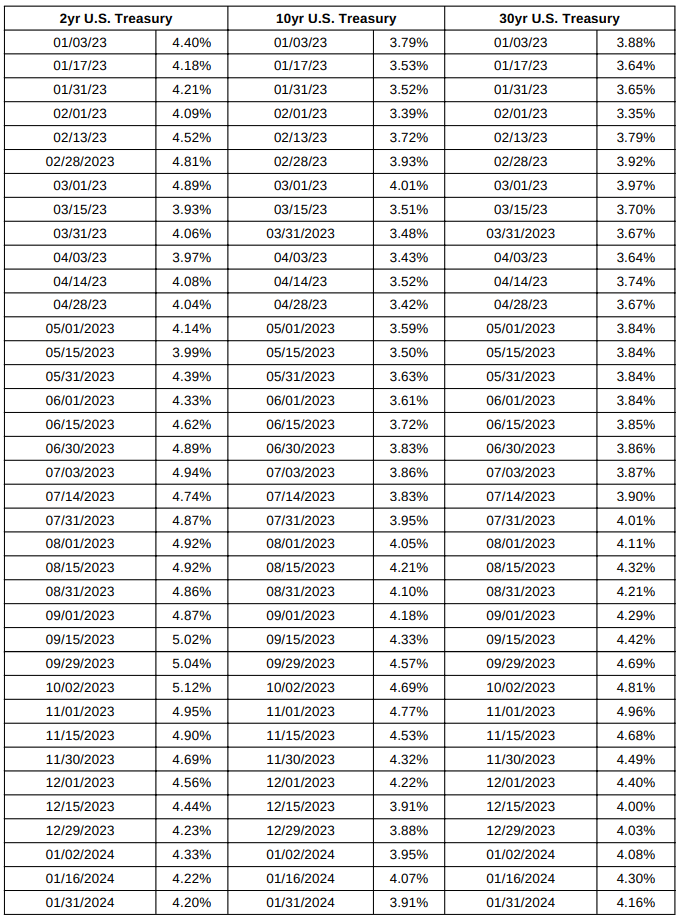
IG Credit spreads in January were 5-25 basis points tighter following a December and November move tighter, as volatility dissipated from the credit markets and spreads traded in a 10-45 basis point range. The US Treasury market saw 2yr notes lower by -13 basis points, 10yr notes lower by -4 basis points and the 30yr closed the month +8 basis points higher. Looking at U.S. Treasury rates in January we saw the month begin with 2’s — 10’s inverted by 38 basis points and 2’s — 30’s inverted by 25 basis points, closing the month with 2’s — 10’s inverted by 29 basis points and 2’s — 30’s inverted by 4 basis points.
As we look at the markets, the Fed just changed language and has taken out the tightening bias following 500+ basis points of rate hikes since March of 2022 but a shift in policy and thinking has now given way to no more hikes and the markets are currently reacting positively to this news with the earliest potential rate cut now in March with the realistic focus for May/June cuts.
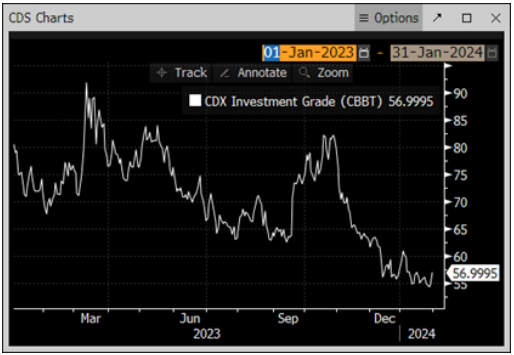
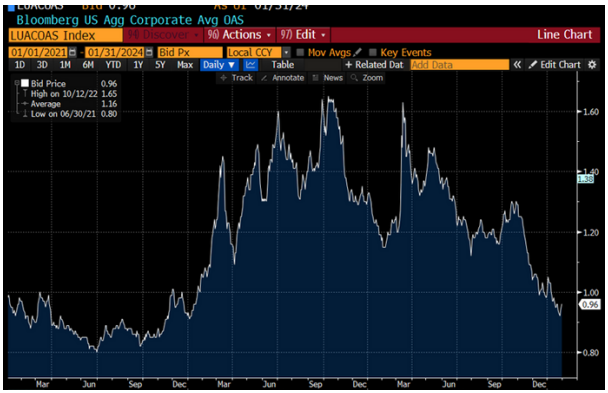
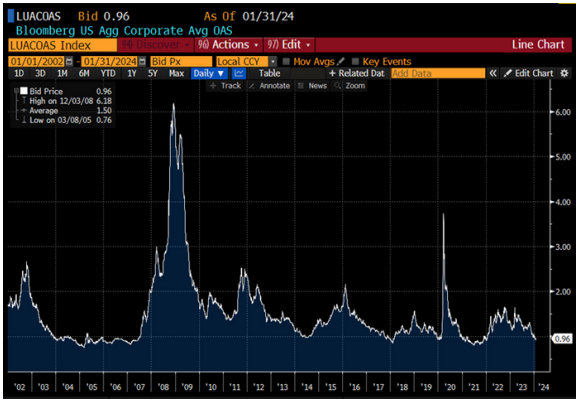
The CDX index opened January ’24 at 58.70 and briefly traded higher to 60.78 before moving lower mid-month as spreads moved tighter with the CDX Index hitting 54.71 on 1/11/24, 55.01 1/19/24 and 54.23 1/29/24 before closing the month at 57 on 1/31/24. The CDX Index began 1/3/23 at 80.53 and is closing 1/31/24 @ 57 some 23.5bps tighter year over year. (Charts Below) The Bloomberg Barclays US Agg Avg Oas opened January 24’ at 1.01 with a brief stop at +1.05 on 1/3/24 and then steadily traded lower hitting .92 on 1/26/24 before closing the month at .96 on 1/31/24. The avg spread for the month was +98. The Bloomberg Barclays US Agg Oas began January 23’ at 1.32 closing 1/31/24 @ .96, 36 basis points lower.
U.S. Treasury Moves
01/03/23 to 01/31/24
CDX Investment Grade Index
January 2024

CDX Investment Grade Index
January 2024
Bloomberg Barclays U.S. Aggregate Corporate Average OAS
01/01/21 to 01/31/24
Bloomberg Barclays U.S. Aggregate Corporate Average OAS
01/01/02 to 01/31/24
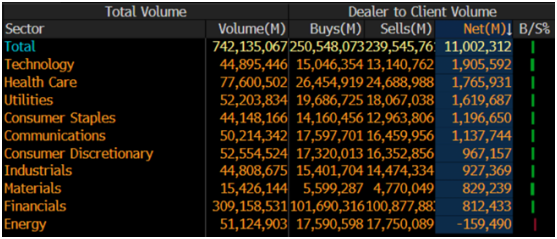
IG credit flows in January came in at a 2 year high of $742 billion vs trailing months, December $541, November $632 billion, October $594 billion, September $522 billion, August $551 billion, July $517 billion, June $577 billion, May $619 billion, April $505 billion, March $683 billion, February $617 billion, January $620 billion. The trailing 6-month avg volume is $597 billion.
Spreads moved tighter in January from 5-25Bps as the massive new issue calendar pushed credit tighter. January saw $11 billion of net client selling as investors sold secondary credit to buy the new issue calendar. The 7-12yr, 3-7yr and 12yr and longer parts of the credit curve led the selling with over $11.8 billion, while 0-1yr and 1-3yr paper saw $1.1 billion of net client buying.
Technology, Health Care and Utilities led the charge in net client selling with just Energy seeing light net client buying. Looking at the markets from a ratings perspective, Baa1/Baa3 paper saw the lion share of net client selling with $8.9 billion, A1/A3 paper saw $2.3 billion and Aaa saw $74 million while Aa1-Aa3 saw net client buying.
IG Credit Flows by Sector
January 2024
IG Credit Maturity Flows
January 2024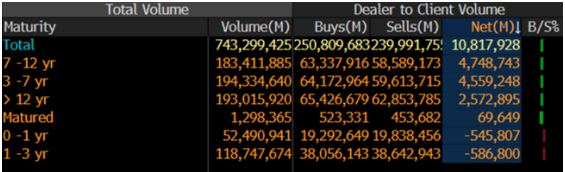
IG Credit by Investment Grade Ratings
January 2024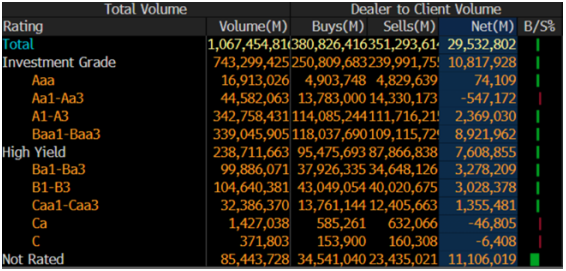
January’s new issue calendar saw a massive month of new deals as secondary trading flows followed suit with the busiest month in over 2 years, leading to heavy net client selling. We saw lower yields on most of the U.S. Treasury curve along with tighter spreads. The U.S. Treasury curve saw 2’s 10’s close inverted by 29 basis points and 2’s 30’s closed inverted by 4 basis points. We closed the month with a Fed policy change, no more rate hikes, and spread’s reaction to easing credit conditions has led to solid backdrop for new issue market.
As we begin the month of February, we will get Unemployment data on Friday, upcoming key CPI and PPI reports and the next Fed meeting is not until 3/20/24. The markets will have to digest yesterday’s news on New York Community Bancorp’s decisions to cut its dividend and boost reserves as the commercial real estate market is rearing its head as NYCB’s stock was down a record 38% along with Tokyo-based Aozora Bank down more than 20% after warning of a loss tied to investments in US commercial property. We have not seen moves like this since the collapse of Silicon Valley Bank last March.
Over the past 3 ½ months we have seen risk premiums on U. S. investment grade credit narrowing to the tightest levels in over 2 years, on expectations that the Fed has reached the top of the Fed-tightening cycle. As we continue to get further data reinforcing that sentiment, it should continue to fuel favorable conditions in the new issue investment grade market. The new issue calendar is calling for $150 billion for the month of February. Forecast for 2024 are calling for $1.2 trillion to $1.35 trillion.
Great job by the AmeriVet Securities team in January as we were a Sr Co-Manager on $5.75Bln 6NC5 and 11NC tranche for Wells Fargo, Co-Lead Manager on $4Bln 2-part deal for UBS Group AG, Co-Manager on 1Bln 2-part deal for Duke Energy Carolinas, Co-Manager on $1.4Bln 2-part deal for Southern California Edison, Junior Co-Manager on $4Bln 4-part deal for Royal Bank of Canada, and Co-Manager on $2.5Bln 11NC10 tranche for Morgan Stanley.
The AmeriVet Securities sales team continues to bring in a large volume of differentiated orders from Tier II & Tier III accounts on new issue deals.