July Credit Snapshot


In July, the credit markets saw a new issue calendar that topped monthly expectations as spreads ripped tighter amidst continued inflation. Supply came in at $87.4 billion, topping expectations of $80 billion.
The U.S. Treasury market was flatter by 14 basis points as the Fed once again lowered the benchmark rate by 75 basis points. Throughout the first half of the year, we have seen a dramatic and violent repricing of risk assets. Spreads traded in a 15-45 basis point range in July and were tighter by 10-30 basis points despite all the market volatility.
July saw solid secondary activity but was once again heavily weighted with net client selling of over $10.7 billion, as investors sold secondary paper to buy the new issue calendar as many issuers exited earnings blackouts and issued new debt.
In addition, this month we saw four of the big six money center banks come to market post earnings and issue multi-tranche deals along with several of the regional banks.
Traders and investors struggled throughout the month as we saw big swings that gave way to a spread rally that bounced off the widest levels of the year to close tighter for the month. There was also plenty of volatility in equities as we continue to see big swings, soaring energy prices, along with daily volatility in U.S. Treasuries, which saw the month close with an inverted yield curve and created a difficult market for fixed income issuers, investors and traders to navigate.
| Issuance Stats | IG (ex-SA) Total |
| MTD | $87.4 billion |
| YTD |
$803.4 billion |
| Supply Run Rate | |
| IG Gross (ex-SSA) | YTD |
| 2022 | $803.4 billion (-7%) |
| 2021 |
$861 billion |
IG credit spreads were 10-30 basis points tighter and traded in a wide range for the month (15-45 bps) closing at the month tights. The U.S. Treasury market flattened with the 2yr note rising +4 basis points, the 10yr was lower by -24 basis points and the 30yr closing the month at -10 basis points lower.
Mid-month saw a spike in U.S. Treasury levels with the 2yr peaking at 3.13%, 10yr at 2.93% and 30yr lower by 1 basis point at 3.10% but that gave way to a volatile close into month-end in rates that saw 2’s 10’s inverted by 24 basis points. Looking at U.S. Treasury rates in July we saw the month begin with 2’s — 10’s at +4 basis points and 2’s — 30’s at +27 basis points, closing the month with 2’s — 10’s inverted by 24 basis points and 2’s — 30’s at +13 basis points.
The Fed continued its 75 basis point rate hike, in an effort to get a better handle on soaring inflation and global market volatility, which has produced a difficult market environment for participants to navigate and invest.
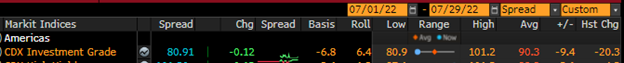
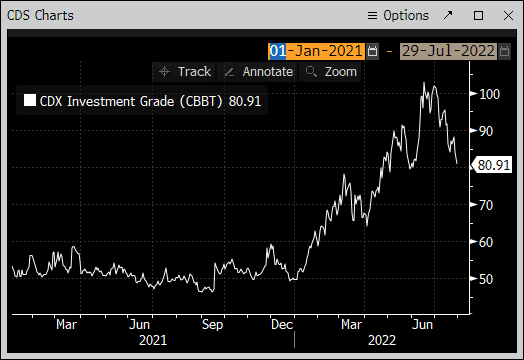
The CDX index began July 2022 at 101.24 on the first of the month and traded at lower levels throughout July, with some mid-month market volatility, before closing the month at 80.91.
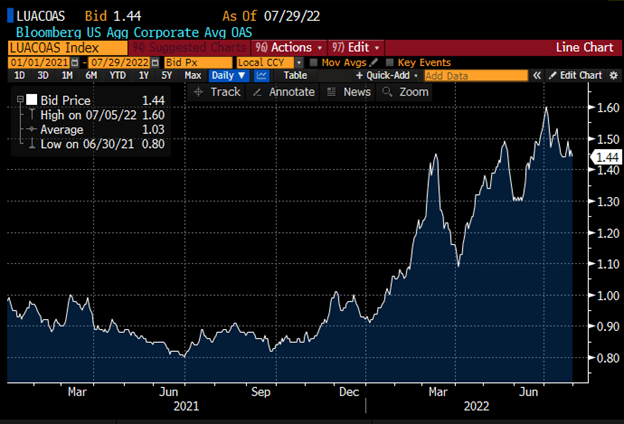
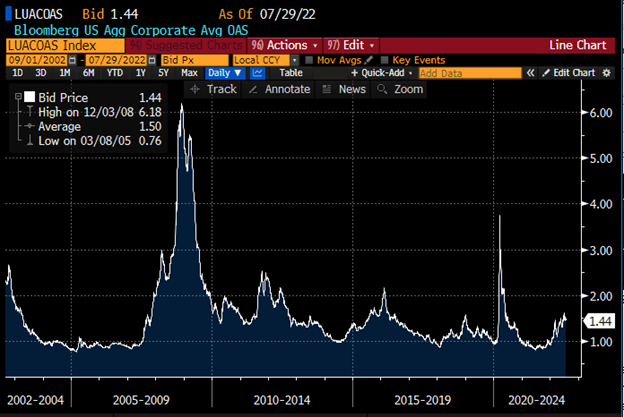
The Bloomberg Barclays U.S. Aggregate Average OAS opened July 2022 at 1.58 and traded steadily lower throughout the month with a bit of volatility touching the months low on July 20, at +144, then traded higher before re-testing the low level at 1.44 on July 29.
See charts below for more information.
U.S. Treasury Moves
December 31, 2021 – July 29, 2022
| 2yr U.S. Treasury | 10yr U.S. Treasury | 30yr U.S. Treasury | |||
| December 31 | 0.73% | December 31 | 1.52% | December 31 | 1.90% |
| January 3 | 0.78% | January 3 | 1.63% | January 3 | 2.01% |
| January 18 | 1.06% | January 18 | 1.87% | January 18 | 2.18% |
| January 31 | 1.18% | January 31 | 1.79% | January 31 | 2.11% |
| February 1 | 1.18% | February 1 | 1.81% | February 1 | 2.19% |
| February 15 | 1.58% | February 15 | 2.05% | February 15 | 2.37% |
| February 28 | 1.46% | February 28 | 1.86% | February 28 | 2.19% |
| March 1 | 1.31% | March 1 | 1.72% | March 1 | 2.11% |
| March 15 | 1.85% | March 15 | 2.15% | March 15 | 2.49% |
| March 31 | 2.28% | March 31 | 2.32% | March 31 | 2.44% |
| April 1 | 2.44% | April 1 | 2.40% | April 1 | 2.44% |
| April 14 | 2.47% | April 14 | 2.66% | April 14 | 2.92% |
| April 29 | 2.70% | April 29 | 2.85% | April 29 | 2.96% |
| May 2 | 2.73% | May 2 | 2.99% | May 2 | 3.07% |
| May 16 | 2.58% | May 16 | 2.88% | May 16 | 3.09% |
| May 31 | 2.53% | May 31 | 2.85% | May 31 | 3.07% |
| June 1 | 2.66% | June 1 | 2.87% | June 1 | 3.09% |
| June 15 | 3.20% | June 15 | 3.39% | June 15 | 3.39% |
| June 30 | 2.95% | June 30 | 2.97% | June 30 | 3.18% |
| July 1 | 2.84% | July 1 | 2.88% | July 1 | 3.11% |
| July 15 | 3.13% | July 15 | 2.93% | July 15 | 3.10% |
| July 29 | 2.88% | July 29 | 2.64% | July 29 | 3.01% |
CDX Investment Grade Index
July 2022
CDX Investment Grade Index
July 2022
Bloomberg Barclays U.S. Aggregate Corporate Average OAS
January 1, 2021 – July 29, 2022
Bloomberg Barclays U.S. Aggregate Corporate Average OAS
September 1, 2002 – July 29, 2022
IG credit flows for July came in at $459 billion vs trailing months with June at $550 billion, May at $549 billion, April at $541 billion, March at $630 billion, February at $489 billion and January at $483 billion. The trailing six-month average volume is $536 billion.
July saw a new issue calendar that exceeded expectations and tighter spreads, along with the continued trend of net client selling, that was more than double previous months. July saw $10.7 billion in net client selling, following the start of earnings, and a new issue calendar that topped expectations and saw investors sell secondary paper to buy the calendar.
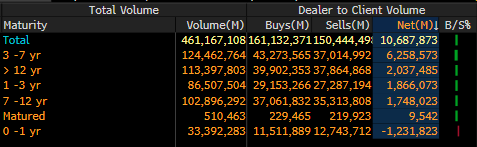
Once again, the front end of the credit curve saw the only net client buying, with 0-1yr paper seeing over $1.2 billion. The 3-7yr part of the curve dominated the selling with over $6.2 billion, 12-30yr saw over $2 billion and the 1-3yr and 7-12yr part of the credit curve saw net client selling of $1.8 billion and $1.7 billion.
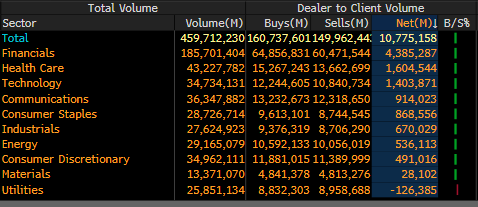
The financial sector dominated net client selling with $4.3 billion, health care at $1.6 billion, technology at $1.4 billion and communications $914 million.
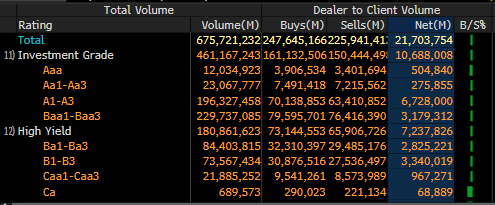
In July, only one sector saw net client buying, with utilities seeing $126 million. From a ratings perspective, Baa1/Baa3 paper saw $3.1 billion of net client selling, along with A1/A3 paper seeing a massive $6.7 billion of net client selling.
See IG credit flow charts below for more information.
IG Credit Flows by Sector
July 2022
IG Credit Maturity Flows
July 2022
IG Credit by Investment Grade Ratings
July 2022
July saw a rebound in the new issue calendar that topped monthly expectations, a flattening and inverted U.S. Treasury curve, solid secondary trading flows and continued net client selling as spreads bounced of the YTD widest levels of the year, to close tighter on the month. The U.S. Treasury curve flattened by 14 basis points, and we saw 2’s 10’s inverted by 24 basis points to close the month.
As we look to August and the dog days of summer, the Fed will take a break from monthly meetings, as their next scheduled meeting is slated for September 21.
We saw investors push spreads tighter, as they bounced off the YTD wide trading levels. We saw many new deals get priced from mid-month on, as issuers posted earnings and brought new deals to the market, following the month of June which saw deals pulled, postponed and canceled, due to all the market volatility.
We enter August with all eyes on the next Fed move, inflation, gas prices, and next Friday’s unemployment data. August is typically one of the slowest deal months, with projections coming in at $25-30 billion for the first week and just $70 billion for the month.
Great job by the AmeriVet Securities team in July, as we were Co-Manager on a deal for Santander Drive Auto Receivables Trust 2022-4, CarMax Auto Owner Trust 2022-3, PG&E Wildlife Recovery Funding Series $3.9 billion 2022-B Rate Reduction Bond Securitization, Joint Lead Manager on a $2 billion 4NC3 Tranche for Morgan Stanley, Co-Manager on a $7 billion two-part deal for JPMorgan and Co-Manager on a $10 billion three-part deal for Bank of America.
The AmeriVet Securities sales team continues to bring in large volumes of differentiated orders from Tier II and Tier III accounts on new issue deals.