July Credit Snapshot


The credit markets in July topped monthly expectations as volatility slowed for the second straight month. The new issue calendar came in at $88.225Bln, topping expectations by 17%, the month was expecting $75Bln vs July 2022 $87.4Bln. The U.S. Treasury market saw 2’s—10’s close inverted by 92 basis points after beginning the month inverted by 108Bps and 2’s-30’s inverted by 86 basis points at month end after opening the month inverted by 107Bps.
Spreads were 5 to 30 basis points tighter and traded in a 10-40 basis point range on the month as we saw less volatility. July saw lighter secondary trading activity as markets digested another Fed rate hike late in the month, during what has been mixed second quarter earnings so far. We saw heavy net client selling with July coming in at $12Bln on tighter spreads.
The markets are now laboring over another potential Fed rate hike September 20, but we will have plenty of data to back up whatever decision Fed Chair Powell and the Fed governors decide. The banking sector remains under scrutiny as we close out July along with the regional banks, as proposed increases in capital requirements could impact issuance between now and the end.
| ISSUANCE STATS | IG (ex-SSA) Total |
| MTD | $88.225Bln |
| YTD | $789.31Bln |
Supply Run Rate
| IG Gross (ex-SSA) | YTD |
| 2023 | $789.31Bln |
| 2022 | $803.44Bln |
| 2021 | $861Bln |
IG credit spreads were 5 to 30 basis points tighter and traded in a wide range for the month (10-40 basis points) and are now trading at the YTD lows for spreads. U.S. Treasury market saw 2yr notes lower by -7 basis points, 10yr notes higher by +9 basis points and the 30yr closed the month 14 basis points higher. Looking at U.S. Treasury rates in July we saw the month begin with 2’s — 10’s inverted by 108 basis points and 2’s — 30’s by 107 basis points, closing the month with 2’s — 10’s inverted by 92 basis points and 2’s — 30’s inverted by 86 basis points. The Fed paused at the June 14 meeting, but July 26, they raised 25 basis points, bringing the tally to 500+ basis points of hikes since March of 2022. The Fed now will have plenty of data to deliberate over between now and their next meeting on September 20, to see if they need one more rate hike to get inflation under control.
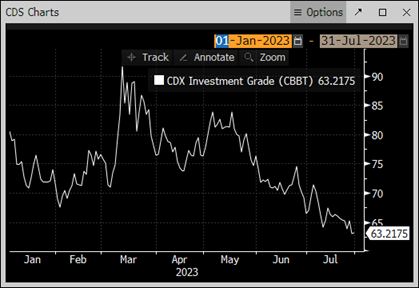
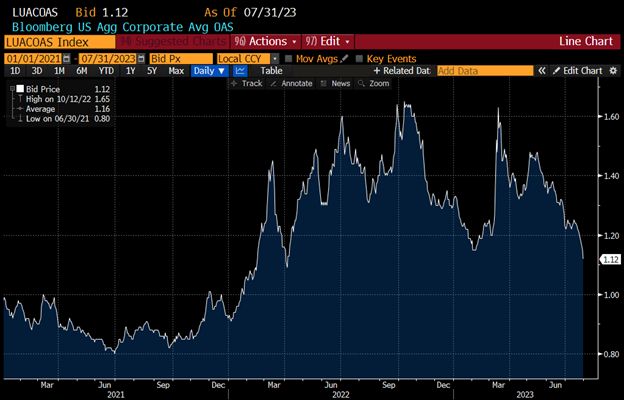
The CDX index opened July ’23 at 66.9 and traded to the month high on 7/06/23 of 71.4 and then ripped tighter to 64 on 7/12 and then traded in a tight range before closing the month at 63.22 on 7/31/23 just off the MTD & YTD low of 63 on 7/28/23. The Bloomberg Barclays U.S. Aggregate Average OAS opened July 23’ at 1.22 and traded to the months high of 1.25 on 7/6/23 and was in a tight range until 7/19/23 at 1.24 and then moved steadily lower to 1.15 on 7/28/23 before closing the month at 1.12 on 07/31/23 the YTD low. See charts below.
Treasury Moves
12/01/22 to 07/31/23
| 2yr US Treasury | 10yr US Treasury | 30yr US Treasury | |||
| 12/01/22 | 4.25% | 12/01/22 | 3.53% | 12/01/22 | 3.64% |
| 12/15/22 | 4.23% | 12/15/22 | 3.44% | 12/15/22 | 3.48% |
| 12/30/22 | 4.41% | 12/30/22 | 3.88% | 12/30/22 | 3.97% |
| 1/03/23 | 4.40% | 1/03/23 | 3.79% | 1/03/23 | 3.88% |
| 1/17/23 | 4.18% | 1/17/23 | 3.53% | 1/17/23 | 3.64% |
| 1/31/23 | 4.21% | 1/31/23 | 3.52% | 1/31/23 | 3.65% |
| 02/01/23 | 4.09% | 02/01/23 | 3.39% | 02/01/23 | 3.55% |
| 02/13/23 | 4.52% | 02/13/23 | 3.72% | 02/13/23 | 3.79% |
| 02/28/23 | 4.81% | 02/28/23 | 3.93% | 02/28/23 | 3.92% |
| 03/01/23 | 4.89% | 03/01/23 | 4.01% | 03/01/23 | 3.97% |
| 03/15/23 | 3.93% | 03/15/23 | 3.51% | 03/15/23 | 3.70% |
| 03/31/23 | 4.06% | 03/31/23 | 3.48% | 03/31/23 | 3.67% |
| 04/03/23 | 3.97% | 04/03/23 | 3.43% | 04/03/23 | 3.64% |
| 04/14/23 | 4.08% | 04/14/23 | 3.52% | 04/14/23 | 3.74% |
| 4/28/23 | 4.04% | 4/28/23 | 3.42% | 4/28/23 | 3.67% |
| 5/01/23 | 4.14% | 5/01/23 | 3.59% | 5/01/23 | 3.84% |
| 5/15/23 | 3.99% | 5/15/23 | 3.50% | 5/15/23 | 3.84% |
| 5/31/23 | 4.39% | 5/31/23 | 3.63% | 5/31/23 | 3.84% |
| 6/01/23 | 4.33% | 6/01/23 | 3.61% | 6/01/23 | 3.84% |
| 6/15/23 | 4.62% | 6/15/23 | 3.72% | 6/15/23 | 3.85% |
| 6/30/23 | 4.89% | 6/30/23 | 3.83% | 6/30/23 | 3.86% |
| 7/03/23 | 4.94% | 7/03/23 | 3.86% | 7/03/23 | 3.87% |
| 7/14/23 | 4.74% | 7/14/23 | 3.83% | 7/14/23 | 3.90% |
| 7/31/23 | 4.87% | 7/31/23 | 3.95% | 7/31/23 | 4.01% |
CDX Investment Grade Index July 2023

CDX Investment Grade Index July 2023
Bloomberg US Agg Corporate Avg OAS 01/01/21—7/31/23
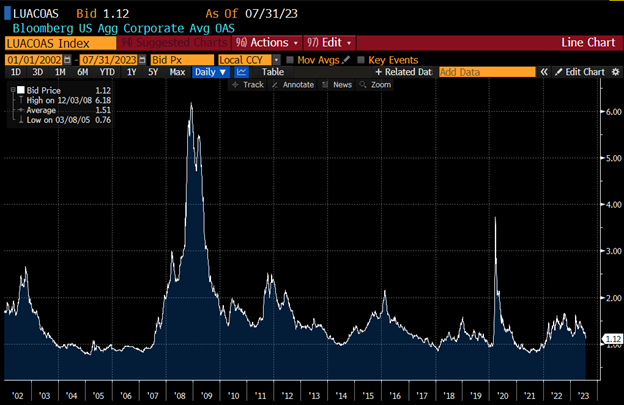
Bloomberg Barclays US Agg Corporate Avg OAS 01/01/02—07/31/23
IG credit flows in July came in at $517Bln vs trailing months, June $577Bln, May $619Bln, April $505Bln, March $683Bln, February $617Bln, January $620Bln, December $467Bln, November $566Bln, October $574Bln, and September $576Bln. The trailing six-month average volume is $586 billion.
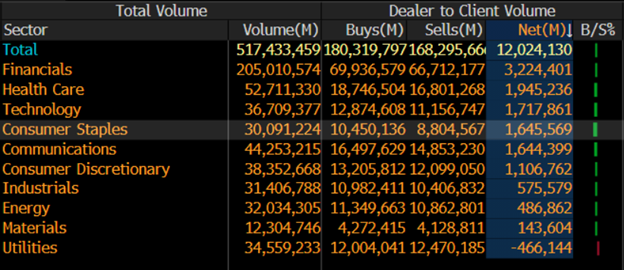
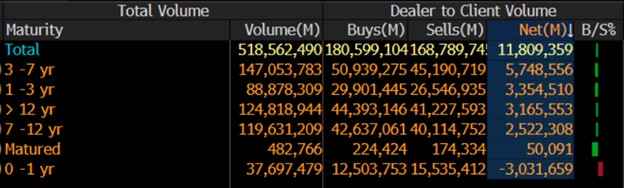
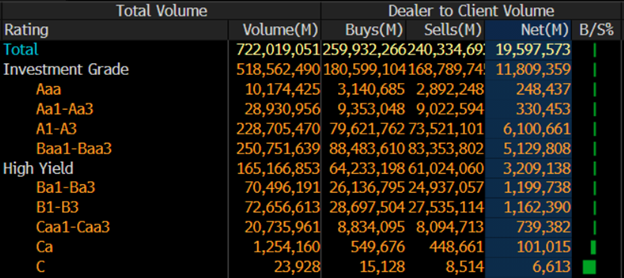
Spreads continue to tighten in the face of net client selling as a new issue calendar topped expectations with massive net client selling on lighter volume. July saw $12Bln of net client selling which rivaled the steady selling we saw in May of $17.4Bln in net client selling. The 3-7yr, 1-3yr, 12yr and 12yr and longer and 7-12yr parts of the credit curve led the selling with over $5.7Bln, $3.3Bln, 3.1Bln and $2.5Bln respectively, while 0-1yr paper saw over $3Bln of net client buying. Just one sector saw net client buying in July, which was Utilities. Financials, Health Care and Technology lead the charge in net client selling with $3.2Bln, $1.9Bln and $1.7Bln, respectively. Looking at the markets from a ratings perspective, A1/A3 and Baa1/Baa3 paper saw the heaviest of net client selling with $6.1Bln and $5.1Bln respectively with all investment grade ratings seeing net client selling. (See IG Credit Flow charts below)
July 2023 IG Credit Flows by Sector
July 2023 IG Credit Maturity Flows
July 2023 IG Credit by Investment Grade Ratings
July’s new issue calendar beat monthly expectations by 17%, while the U.S. Treasury curve saw the long end in rates move higher and the short end rallied, with a curve that flattened. We saw lighter secondary trading flows that led to massive net client selling as investors digested another Fed rate hike along with second quarter earnings.
As the last week of the month closed out, we saw higher long end U.S. Treasury yields that pushed spreads tighter into month end and we are now trading at the YTD tights. The U.S. Treasury curve saw 2’s 10’s close inverted by 92 basis points and 2’s 30’s inverted by 86 basis points. As we begin the month of August, investors will turn their attention to the next unemployment data release on Friday, August 4. We have spreads at YTD tights, the Fed potentially getting to the end of rate hikes, inflation has been coming down, the economy remains strong yet bumpy, second earnings continue to be released and we have plenty of data between now and the September Fed meeting. August’s new issue calendar is expected to be strong, with $85Bln expected for the month and the first week of August adjusted expectations are calling for $25-30Bln, following Monday’s robust start of 10 deals, totaling $19.5Bln.
Great job by the AmeriVet Securities team in July as we were a Co-Manager on Co-Manager on $1Bln 5yr deal for Jefferies Financial Group Inc, Joint Lead Manager on $1.725Bln 7.625% Perp for Wells Fargo, Joint Lead Manager on $8.5Bln two-part deal for Wells Fargo, Joint Lead Manager on $2.25Bln 6NC5 deal for Morgan Stanley and $1.5Bln deal for CarMax Auto Owners Trust.
The AmeriVet Securities sales team continues to bring in a large volume of differentiated orders from Tier II and Tier III accounts on new issue deals.