June Credit Snapshot


The Credit markets in June topped monthly expectations as volatility slowed somewhat following the resolution of the Debt ceiling on June 3. The new issue calendar came in at $91.045Bln, beating expectations by 13% on expectations of $80Bln vs June 2022 $69.05Bln. The U.S. Treasury market saw 2’s—10’s close inverted by 106 basis points after beginning the month inverted by 72Bps and 2’s-30’s inverted by +103 basis points at month end after opening the month inverted by 49Bps. Spreads were unchanged to 15 basis points tighter and traded in a 5-25 basis point range on the month as we saw less volatility. June saw lighter secondary trading activity as markets applauded the pause by the Fed and resolution to the debt ceiling. On the month we saw much lighter net client selling than the previous months with June coming in at $3.6Bln on tighter spreads. The markets are now laboring over potentially 2 more Fed rate hikes and the final days of June saw higher U. S. treasury yields sparking a rally in credit spreads. As we close out the quarter and half year, we will kick off earnings in Financials starting July 14th and all eyes remain on the Banking sector especially the Regional Banks following the mini bank crisis in March. Last week we received good news in the Financial sector as Wall Street’s biggest banks all passed the Federal Reserve’s annual stress test. The annual exam of 23 largest US lenders is closely watched by the financial industry. Results determine how much capital banks need to set aside as a cushion, which potentially clears the way for dividends and stock buybacks as requirements are met. The latest round showed all the firms can withstand a severe global recession and turmoil in real estate market as per the Fed. A positive sign as we head into the summer months.
| ISSUANCE STATS | IG (ex-SSA) Total |
| MTD | $91.045Bln |
| YTD | $701.085Bln (-2% YoY) |
Supply Run Rate
| IG Gross (ex-SSA) | YTD |
| 2023 | $610.04Bln |
| 2022 | $646.99Bln |
| 2021 | $683Bln |
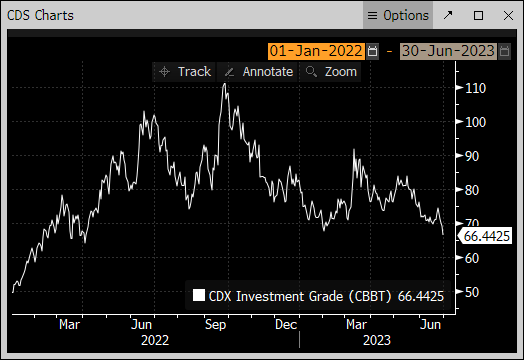
IG Credit spreads in June were unchanged to 15 basis points tighter and traded in a tight range for the month (5-25Bps). US Treasury market saw 2yr notes higher by +56 basis points, 10yr notes higher by +22 basis points and the 30yr closed the month just 2 basis points higher. Looking at U.S. Treasury rates in June we saw the month begin with 2’s — 10’s inverted by +72 basis points and 2’s — 30’s by +49 basis points, closing the month with 2’s — 10’s inverted by +106 basis points and 2’s — 30’s inverted by +103 basis points. The Fed paused at the June 14th meeting after last raising rates on May 3rd by 25 basis points as many debated if they should be raising rates as uncertainty within the banking crisis lingered. The Fed said they wanted to see more data before the next upcoming July 26 meeting to plot the next potential move, however they have been very vocal following the last meeting and pause that they potentially see at least 2 more rate hikes to get inflation under control. They will have plenty of data releases with Friday’s employment number, upcoming quarterly earnings, and inflation readings to evaluate their next move and tame inflation in the second half of the year. The CDX index opened June ’23 at 74 and traded in a tight range before moving to the months high on 6/26/23 at 74.5. The index then steadily moved lower to close at the months low of 66.44(also the 3month low). (Charts Below) The Bloomberg Barclays US Agg Avg Oas opened June 23’ at 1.38 and traded in a tight range until 6/14/23 at 1.35 and moved steadily lower to close the month at 1.23 on 06/30/23. (Charts Below)
Treasury Moves
12/01/22 to 6/30/23
| 2yr US Treasury | 10yr US Treasury | 30yr US Treasury | |||
| 12/01/22 | 4.25% | 12/01/22 | 3.53% | 12/01/22 | 3.64% |
| 12/15/22 | 4.23% | 12/15/22 | 3.44% | 12/15/22 | 3.48% |
| 12/30/22 | 4.41% | 12/30/22 | 3.88% | 12/30/22 | 3.97% |
| 1/03/23 | 4.40% | 1/03/23 | 3.79% | 1/03/23 | 3.88% |
| 1/17/23 | 4.18% | 1/17/23 | 3.53% | 1/17/23 | 3.64% |
| 1/31/23 | 4.21% | 1/31/23 | 3.52% | 1/31/23 | 3.65% |
| 02/01/23 | 4.09% | 02/01/23 | 3.39% | 02/01/23 | 3.55% |
| 02/13/23 | 4.52% | 02/13/23 | 3.72% | 02/13/23 | 3.79% |
| 02/28/23 | 4.81% | 02/28/23 | 3.93% | 02/28/23 | 3.92% |
| 03/01/23 | 4.89% | 03/01/23 | 4.01% | 03/01/23 | 3.97% |
| 03/15/23 | 3.93% | 03/15/23 | 3.51% | 03/15/23 | 3.70% |
| 03/31/23 | 4.06% | 03/31/23 | 3.48% | 03/31/23 | 3.67% |
| 04/03/23 | 3.97% | 04/03/23 | 3.43% | 04/03/23 | 3.64% |
| 04/14/23 | 4.08% | 04/14/23 | 3.52% | 04/14/23 | 3.74% |
| 4/28/23 | 4.04% | 4/28/23 | 3.42% | 4/28/23 | 3.67% |
| 5/01/23 | 4.14% | 5/01/23 | 3.59% | 5/01/23 | 3.84% |
| 5/15/23 | 3.99% | 5/15/23 | 3.50% | 5/15/23 | 3.84% |
| 5/31/23 | 4.39% | 5/31/23 | 3.63% | 5/31/23 | 3.84% |
| 6/01/23 | 4.33% | 6/01/23 | 3.61% | 6/01/23 | 3.84% |
| 6/15/23 | 4.62% | 6/15/23 | 3.72% | 6/15/23 | 3.85% |
| 6/30/23 | 4.89% | 6/30/23 | 3.83% | 6/30/23 | 3.86% |
CDX Investment Grade Index June 2023

CDX Investment Grade Index June 2023
Bloomberg US Agg Corporate Avg OAS 01/01/21—6/30/23 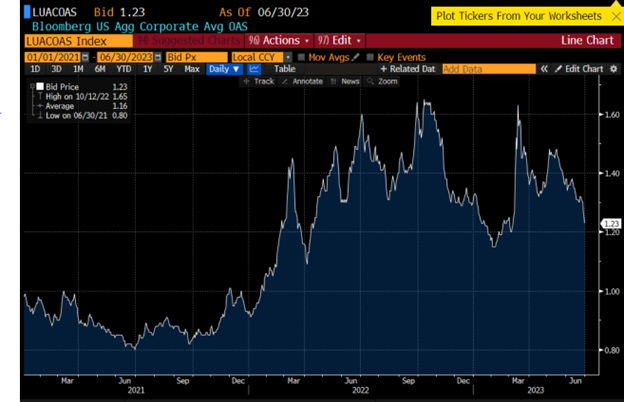
Bloomberg Barclays US Agg Corporate Avg OAS 01/01/02—06/30/23 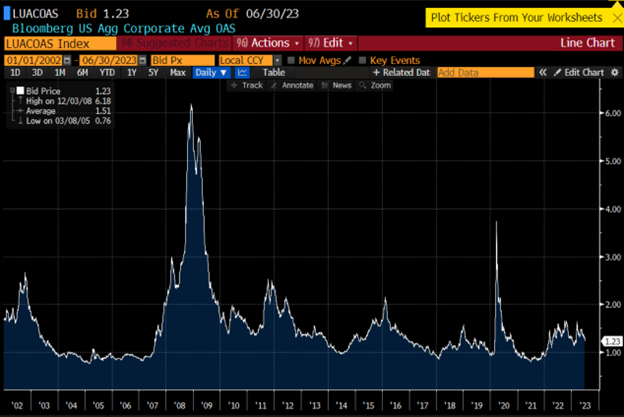
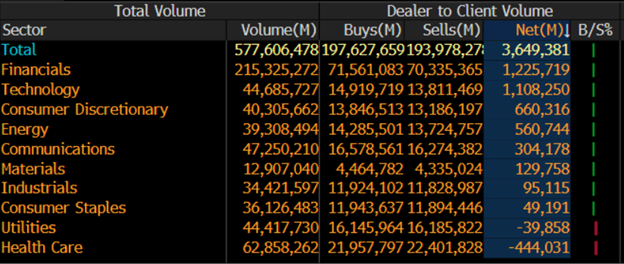
IG credit flows in June came in at $577Bln vs trailing months, May $619Bln, April $505Bln, March $683Bln, February $617Bln, January $620Bln, December $467Bln, November $566Bln, October $574Bln, and September $576Bln. The trailing 6-month avg volume is $603 billion. We saw a better-than-expected new issue calendar that topped expectations with tighter spreads along with lighter net client selling on decent volume. June saw just $3.6Bln of net client selling which was a much slower pace than we saw in May with $17.4Bln in net client selling. The 3-7yr and 12yr and longer part of the credit curve led the selling with just over $5Bln, $3Bln and $2Bln respectively, while 0-1yr paper saw over $2.6Bln of net client buying. Just 2 sectors saw net client buying in June, Utilities and Health Care. Financials and Technology lead the charge in net client selling with $1.2Bln and $1.1Bln, respectively. Looking at the markets from a ratings perspective, Aa1-Aa3, A1-A3, and Baa1/Baa3 paper saw the heaviest of net client selling with all investment grade ratings seeing net client selling. (See IG Credit Flow charts below)
June 2023 IG Credit Flows by Sector
June 2023 IG Credit Maturity Flows 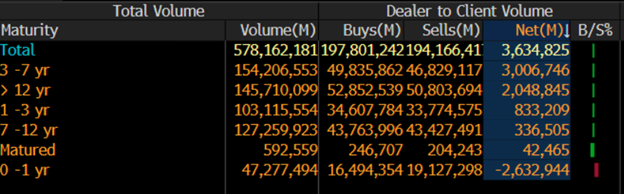
June 2023 IG Credit by Investment Grade Ratings 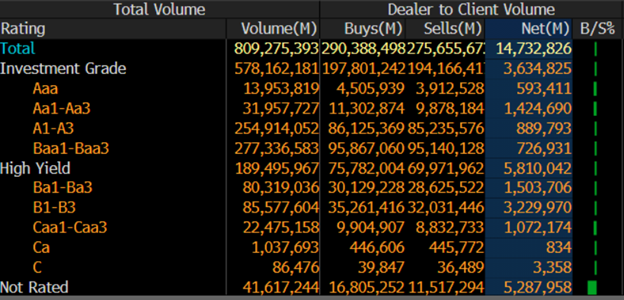
June’s new issue calendar beat monthly expectations by 13%, while the U.S. Treasury curve saw rates move higher and a curve that is more inverted. We saw lighter secondary trading flows that led to lighter net client selling as investors applauded the resolution to the debt ceiling and a pause by the Fed. As the last week of the month closed out, we saw higher U.S. Treasury yields that pushed spreads tighter into month end as investors turned their attention to the upcoming Fed decision in July and 2 more potential rate hikes for the year. The U.S. Treasury curve saw 2’s 10’s close inverted by 106 basis points and 2’s 30’s inverted by 103 basis points. Following the July 4th holiday investors will turn their attention to the next Unemployment data release on Friday July 7th along with key economic data releases and the next batch of 2nd Quarter earnings set to begin on July 14th with key Money Center Banks set to report. July’s new issue calendar is expected to be on the lighter side with $75Bln expected for the month and the 1st week of July just $5Bln expected in the holiday shortened week.
Great job by the Amerivet Securities team in Junes as we were a Co-Manager on $3.25Bln 3-part deal for Pacific Gas & Electric, $350mm 10yr deal for Piedmont Natural Gas, $1.15Bln 2-part deal for Bank of Nova Scotia, $850mm 6NC5 for Ally Financial, $500mm 6NC5 for Santander Holdings USA, $2Bln 11NC10 Sub for HSBC Holdings, $1.75Bln 2-part deal for Duke Energy Carolinas, $4.25Bln 5-part deal for Nasdaq Inc, EU750mm 8yr for Nasdaq Inc and $2.5Bln 2-part deal for Mizuho Financial. The Amerivet Securities sales team continues to bring in a large volume of differentiated orders from Tier II & Tier III accounts on new issue deals.