March Credit Snapshot


In March, the credit markets saw a massive new issue calendar that shattered monthly expectations, as spreads were unchanged to 15 basis points tighter.
March supply of $229.9 billion is the fourth highest on record; 70% higher than the $135 billion projected by dealers and 17% higher than the $196 billion priced last March (the fifth largest monthly total on record).
The U.S. Treasury market was flatter by 64 basis points as rates rose for the month amidst the Fed rate hike of 1/4 point. Spreads traded in a 25-50 basis point range in March as the markets continue to be challenged from all directions from volatility.
Secondary activity in March saw massive net client selling of over $9.9 billion as the new issue calendar saw heavy issuance and the Fed decision of raising the benchmark lending rate 1/4 point had investors selling secondary paper amidst U.S. Treasury curve chaos.
March saw plenty of volatility in the markets, from global equities, geopolitical issues with Russia and Ukraine, energy prices and daily volatility in the U.S. Treasury rate market, all of which contributed to a difficult market for fixed income participants to navigate.
IG credit spreads for March were unchanged to 15 basis points tighter and traded in a wide range for the month (25-50 basis points) before rallying into the end of the month.
| Issuance Stats | IG (ex-SSA) Total |
| MTD | $229.9 billion |
| YTD | $453.3 billion |
| Supply Run Rate | |
| IG Gross (ex-SSA) | YTD |
| 2022 | $453.3 billion (+4%) |
| 2021 | $437.1 billion |
The U.S. Treasury market saw a continued flattening trade with the 2yr note jumping +97 basis points higher, the 10yr +60 basis points higher and the 30yr +33 basis points higher. When looking at U.S. Treasury rates in March, we saw the month begin with 2’s — 10’s at 41 basis points and 2’s — 30’s at 80 basis points. As the Russia and Ukraine war dragged on and we got the Fed rate decision, we closed the month with 2’s — 10’s at +4 basis points and 2’s — 30’s closed at +16 basis points, a massive flattener.
We did see a brief 2’s—-10’s inversion on the last day of trading, as 2yr yields inverted to 10yr yields, for the first time since 2019. Many say this could be a warning sign of an upcoming recession. We saw a heavy rate selloff, coupled with a heavy new issue calendar and massive selling of secondary paper.
The Fed has a tough task ahead as they navigate more rate hikes in the middle of the Russia and Ukraine war in addition to spiking inflation on all fronts.
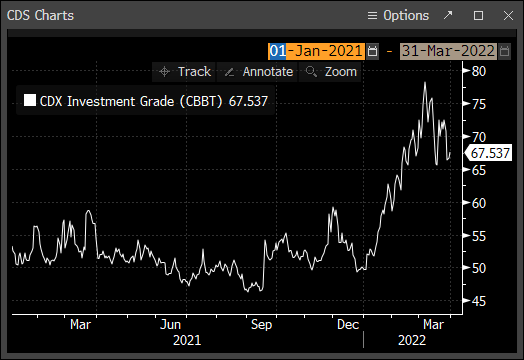
The CDX index in March 2022 began at 72.389 on March 1 and steadily traded higher to the monthly high of 78.2 on March 7, before closing the month at 67.5. Massive inter-month volatility plagued March, before seeing a rally into the end of the month.
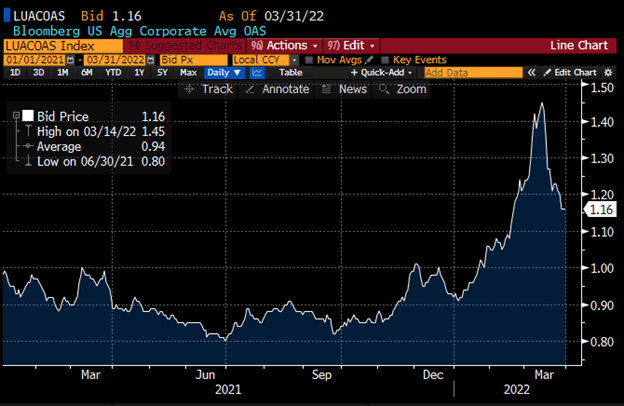
The Bloomberg Barclays U.S. Aggregate Average OAS opened March 2022 at 1.24 and steadily traded to the monthly high of 1.45 on March 14, before closing the month on the heels of a rally at 1.16 on March 31.
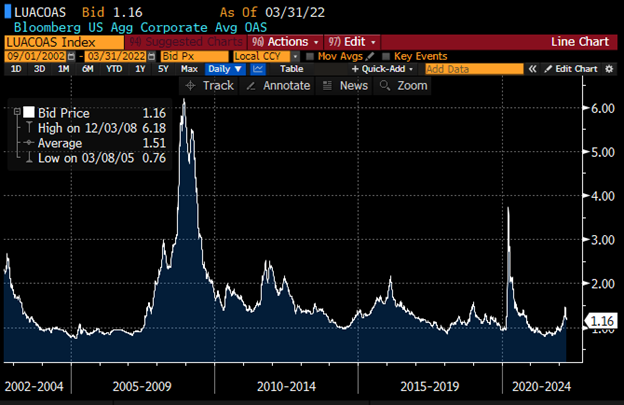
The average high-grade corporate bond spread hit a 16-year low of .80 basis points back on June 30, which closed out the month.
See the charts below for more information.
U.S. Treasury Moves
December 31, 2021 – March 31, 2022
| 2yr U.S. Treasury | 10yr U.S. Treasury | 30yr U.S. Treasury | |||
| December 31 | 0.73% | December 31 | 1.52% | December 31 | 1.90% |
| January 3 | 0.78% | January 3 | 1.63% | January 3 | 2.01% |
| January 18 | 1.06% | January 18 | 1.87% | January 18 | 2.18% |
| January 31 | 1.18% | January 31 | 1.79% | January 31 | 2.11% |
| February 1 | 1.18% | February 1 | 1.81% | February 1 | 2.19% |
| February 15 | 1.58% | February 15 | 2.05% | February 15 | 2.37% |
| February 28 | 1.46% | February 28 | 1.86% | February 28 | 2.19% |
| March 1 | 1.31% | March 1 | 1.72% | March 1 | 2.11% |
| March 15 | 1.85% | March 15 | 2.15% | March 15 | 2.49% |
| March 31 | 2.28% | March 31 | 2.32% | March 31 | 2.44% |
CDX Investment Grade Index

CDX Investment Grade Index
Bloomberg Barclays U.S. Aggregate Corporate Average OAS
January 1, 2021 – March 31, 2022
Bloomberg Barclays U.S. Aggregate Corporate Average OAS
September 1, 2002 – March 31, 2022
IG credit flows came in at a massive $630 billion (a high for the year thus far) vs the trailing months, with February 2022 at $489 billion, January 2022 at $483 billion, the December 2021 low of $372 billion, November 2021 at $439 billion, October 2021 at $458 billion. The trailing six-month average volume is $478 billion.
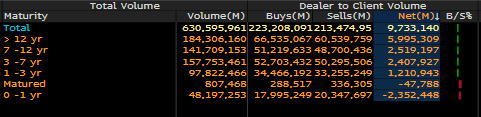
March’s massive new issue calendar along with higher rates and net client selling had investors putting money to work in the front end of the credit curve with 0-1yr paper seeing over $2.3 billion of net client buying.
The belly and back end of the credit curve saw net client selling with 12yr and longer paper seeing over $5.9 billion, 7-12yr over $2.5 billion of net client selling, 3-7yr $2.4 billion net client selling and 1-3yr paper seeing $1.2 billion of net client selling.
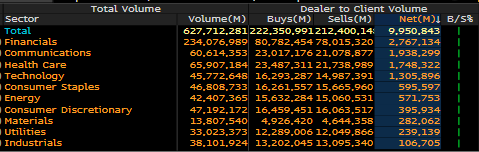
The financial sector dominated net client selling with over $2.7 billion, followed by communications at $1.9 billion, health care at $1.7 billion and technology at $1.3 billion. All sectors saw net client selling in March.
See the IG credit flow charts below for more information.
IG Credit Flows by Sector
March 2022
IG Credit Maturity Flows
March 2022
March saw a new issue calendar that shattered monthly expectations, volatility, rising U.S. Treasury rates, massive secondary trading flows and heavy net client selling, despite unchanged to tighter spreads as we rallied into the end of the month.
The U.S. Treasury curve flattened by a massive 64 basis points, as rates moved higher, fueled by the Fed rate hike, the Russia and Ukraine war and continued spiking inflation as we have shifted focus away from Covid-19. The credit markets can’t take their eyes off Russia and Ukraine, the Fed and the U.S. Treasury curve, as investors try and decide where on the curve to invest and deploy cash.
We were expecting $135 billion of new supply for March and that came in at $229.9 billion. The credit markets, despite all the volatility, had been trading in a very orderly fashion without any major panic. However, March saw massive secondary trading flows, 25-50 basis point ranges and multiple days of 5-15 basis point swings in spreads.
We enter April with all eyes on Russia and Ukraine, as we enter week seven of the conflict with very little end in sight. In addition, the Fed continues to try and navigate the next rate hike in the middle of massive inflation.
“Covid fatigue” continues to take a back seat but virus numbers overseas seem to be on the rise, as a new variant spreads globally. April is historically a much slower new issue calendar than March, with projections coming in at $90-$100 billion.
Volatility remains ahead for the markets and we will have to initially battle with employment data next, and many other key factors, as April unfolds.
Great job by the AmeriVet Securities team in March as we were co-manager on a $2.5 billion 15NC10 deal for Bank of America, co-manager on a $3 billion three-part deal for Toyota Motor Credit and co-manager on a $4 billion 6NC5 deal for Wells Fargo.
The AmeriVet Securities sales team continues to bring in large volumes of differentiated orders from Tier II and Tier III accounts on new issue deals.