May Credit Snapshot


The Credit markets in May saw a new issue calendar that came in shy of monthly expectations as spreads continued to move tighter and the treasury curve flattened after the past few months saw a steepening trade take place.
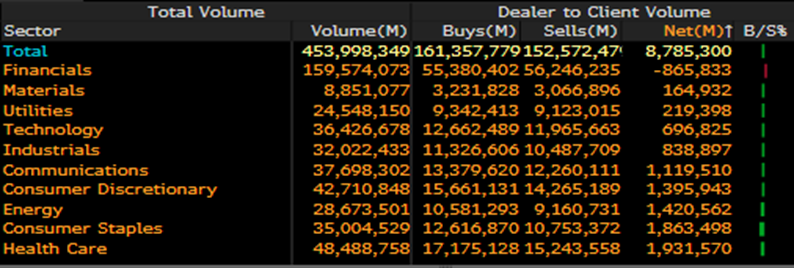
Spreads traded in a narrow range in May; as a less volatile treasury market calmed the credit markets along with a busy new issue calendar. Credit spreads in May were unchanged to 20 basis points tighter with paper trading in a 5 to 20 basis point range for the month. The New Issue market fell shy of monthly estimates of $150 billion, closing the month at $136 billion. Secondary activity in May saw net client selling of over
$8.7Bln that was heavily weighted in Health Care, Consumer Staples, Energy, Consumer Discretionary, Communications, Industrials and Technology.
| Issuance Stats | IG (ex-SSA) Total |
| WTD | $35.6b |
| MTD | $136.5b |
| YTD | $684.39b |
| Supply Run Rate | |
| IG Gross (ex-SSA) (As of May 26) | YTD |
| 2021 | $684.39b |
| 2020 | $984.5b (-30%) |
IG Credit spreads for the month of May were unchanged to 20 basis points tighter as
U.S. Treasury volatility cooled a bit and we saw a rate rally into month end. The moves in the U.S. Treasury market continued to have investors moving money around the curve and that is driving the move in credit spreads. Both the 10yr & 30yr treasury’s rallied this month closing 6 and 10 basis points lower to end the month of May.
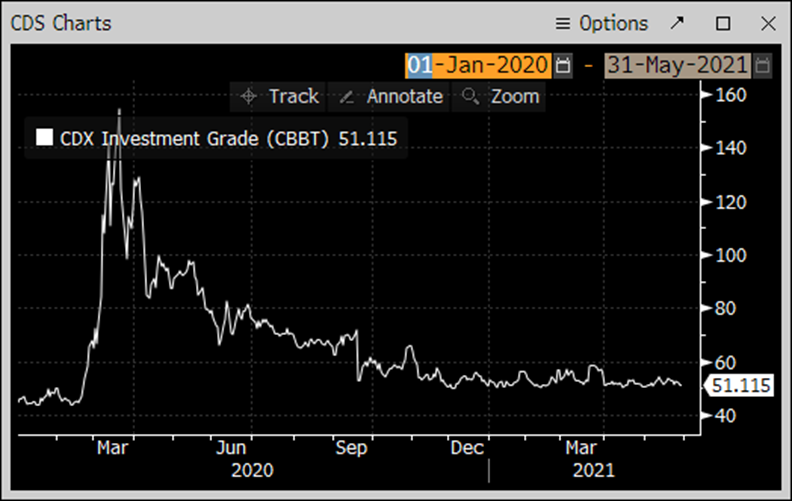
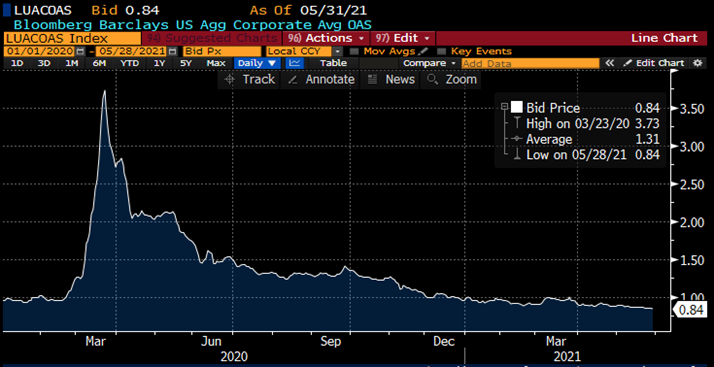
The CDX Investment Grade Index opened the month of May at 50.678 as well as the monthly low before moving wider on 5/12/21 at 54.1 and closing the month at the 51.12. (see Chart Below) The Bloomberg Barclays US Agg Avg Oas closed out the month of May at 0.84 and traded in a tight range with the high on 5/03/21 at 0.89. (Chart Below)
Treasury Moves from January 4, 2021 to May 28, 2021
| 2yr U.S. Treasury | 10yr U.S. Treasury | 30yr U.S. Treasury | |||
| 1/4/2021 | 0.13% | 1/4/2021 | 0.93% | 1/4/2021 | 1.65% |
| 2/1/2021 | 0.09% | 2/1/2021 | 1.09% | 2/1/2021 | 1.84% |
| 3/1/2021 | 0.17% | 3/1/2021 | 1.45% | 3/1/2021 | 2.23% |
| 3/31/2021 | 0.16% | 3/31/2021 | 1.74% | 3/31/2021 | 2.41% |
| 24/1/2021 | 0.17% | 4/1/2021 | 1.69% | 4/1/2021 | 2.34% |
| 4/15/2021 | 0.16% | 4/15/2021 | 1.56% | 4/15/2021 | 2.23% |
| 4/30/2021 | 0.16% | 4/30/2021 | 1.65% | 4/30/2021 | 2.30% |
| 5/3/2021 | 0.16% | 5/3/2021 | 1.63% | 5/3/2021 | 2.30% |
| 5/17/2021 | 0.16% | 5/17/2021 | 1.64% | 5/17/2021 | 2.36% |
| 5/28/2021 | 0.14% | 5/28/2021 | 1.58% | 5/28/2021 | 2.26% |
CDX Investment Grade Index

Bloomberg Barclays U.S. Agg Corporate Avg OAS
IG credit flows for the month of May were on the light side and came in at $453Bln, just below April’s $499Bln, March’s $641Bln, February’s $512Bln and January’s $525Bln.
The trailing six month average volume is $508 billion. The month of May’s solid new issue calendar along with less volatile credit spreads and U.S Treasuries paved the way to lighter secondary volume, and we continued to see investors and portfolio managers moving paper around the credit curve for the 3rd month in a row.
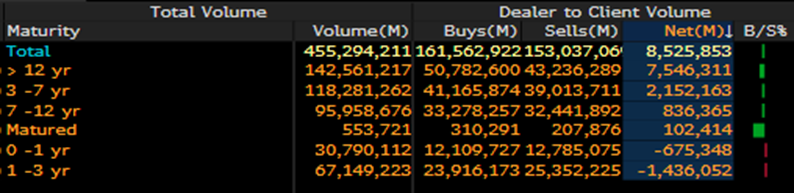
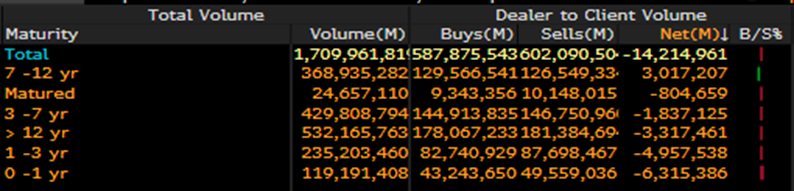
We have seen volatility step aside in the month of May and spreads continued to push tighter and we are seeing very strong demand for secondary paper in the front end of the curve 0-3yr paper. Financials were the lone bright spot in May seeing net client buying but that was on the lighter side and all other sectors saw net client selling. The story continues to be investors moving money around the credit curve and May continued that trend as we saw 12-30yr paper see over $7.5bln in net client selling, 3-7yr maturities
$2.1Bln and 7-12yr maturities $836mm of net client selling. The front end of the curve 1- 3yr maturities saw $1.4Bln of net client buying and 0-1yr saw $675mm of net client buying. Looking at the trailing 5 months back to 1/1/21 investors have been plowing money into 0-3yr maturities with over $11.2Bln in net client buying. (See IG Credit Flow chart below)
May IG Credit Flows
May IG Credit Maturity Flows
Five Months IG Credit Maturity Flows January 1, 2021 – May 31, 2021
The month of May saw a new issue calendar that came in shy of monthly expectations, light secondary trading flows, stability in spreads and tighter ranges for the month. The
U.S. Treasury curve saw a dip in 10yr & 30yr rates and the credit market continues to see investors push money into the front end of the curve.
Great job by the Amerivet Securities team in the month of May as we were Co-Managers on deals from UBS, Bank of America, JPMorgan, Wells Fargo and Morgan Stanley as well as a Structured Products deal from JPMorgan.
The Amerivet Securities sales team continues to bring in large volumes of differentiated orders from Tier II & Tier III accounts on new issue Co-Managed deals. We are expecting $20-25 billion for the first week of June in new issue credit with a total of $110 billion for the month. The credit markets are beginning the month with spreads at or through post-credit crisis lows, and funding costs for companies still remain very attractive.