May Credit Snapshot


The credit markets in May topped monthly expectations as volatility picked up into the middle of the month as the debt ceiling uncertainty caused mixed spreads along with uncertainty around the Fed on a pause or continued rate hikes.
The new issue calendar came in at $149.45Bln, beating expectations by 10% on expectations of $135Bln as issuers rushed into the market. The U.S. Treasury market saw 2’s—10’s close inverted by 76 basis points after beginning the month inverted by 55 basis points and 2’s-30’s inverted by 55 basis points at month end after opening the month inverted by 30 basis points. Spreads were mixed from 10 basis points wider to 15 basis points tighter depending on sector and sub sectors and traded in a 15-55 basis point range on the month.
May saw heavy secondary trading activity as markets labored over the debt ceiling following stability in the market in April, after the mini banking crisis and volatility surrounding the Fed’s next move. On the month, we saw a hefty $16.8Bln in net client selling as spreads were mixed. Concerns remain in the market for the Regional Bank space as the debate continues for a pause or continued rate hikes which present their own unique issues for the banks. The crisis for now seems contained following solid earnings in Financials however a close eye will remain on the space. All eyes will be on the Fed next month on June 14 and their next move as investors, issuers and traders try to navigate difficult market conditions.
| ISSUANCE STATS | IG (ex-SSA) Total |
| MTD | $149.45Bln |
| YTD | $610.04Bln (-4% YoY) |
Supply Run Rate
| 2023 | $610.04Bln |
| 2022 | $646.99Bln |
| 2021 | $683Bln |
IG Credit spreads in May were 10 basis points wider to 15 basis points tighter and traded in a wide range for the month (15-55 basis points). Financials were generally tighter on the month, but other sectors struggled and were generally wider along with the sub-sector of Regional Banks. The US Treasury market saw 2yr notes higher by +25 basis points, 10yr notes higher by +4 basis points and the 30yr closed the month at the same yield it began. Looking at U.S. Treasury rates in May we saw the month begin with 2’s — 10’s inverted by 55 basis points and 2’s — 30’s by 30 basis points, closing the month with 2’s — 10’s inverted by 76 basis points and 2’s — 30’s inverted by 55 basis points. The Fed last raised rates on May 3 by 25 basis points, as many debated if they should be raising rates as uncertainty within the banking crisis lingered.
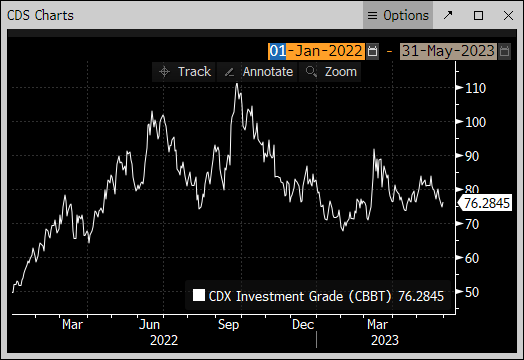
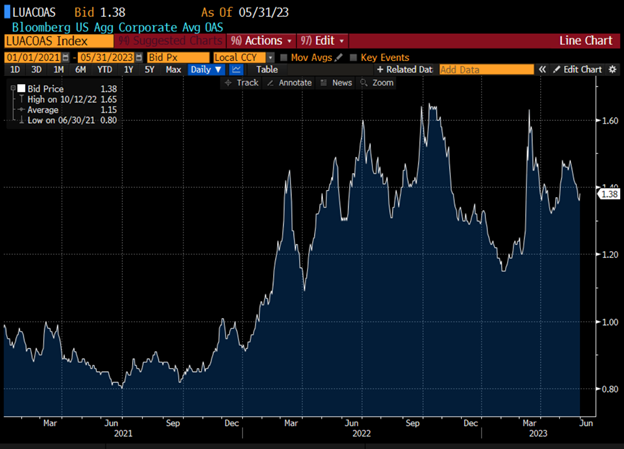
The Fed will meet June 14 for the next potential move. They will have plenty of data releases on employment, earnings, and inflation to evaluate their next move. The CDX index started May’23 at 77.83 and moved to the month high on 5/16/23 @ 83.89 and then traded steadily lower to the month low of 74.6 on 5/30/23 and closed the month at 76.28 on 5/31/23. The Bloomberg Barclays U.S. Aggregate Average OAS opened May 2023 at 1.38 and moved to the months high on 5/04/23 at 1.48 and traded in a tight range until 5/17/23 at 1.46 and moved to the month low of 1.36 on 05/30/23 before closing the month at 1.38 on 5/31/23.
See the charts below for more information.
Treasury Moves
1/31/22 to 4/28/23
| 2yr US Treasury | 10yr US Treasury | 30yr US Treasury | |||
| 1/31/22 | 1.18% | 1/31/22 | 1.79% | 1/31/22 | 2.11% |
| 12/01/22 | 4.25% | 12/01/22 | 3.53% | 12/01/22 | 3.64% |
| 12/15/22 | 4.23% | 12/15/22 | 3.44% | 12/15/22 | 3.48% |
| 12/30/22 | 4.41% | 12/30/22 | 3.88% | 12/30/22 | 3.97% |
| 1/03/23 | 4.40% | 1/03/23 | 3.79% | 1/03/23 | 3.88% |
| 1/17/23 | 4.18% | 1/17/23 | 3.53% | 1/17/23 | 3.64% |
| 1/31/23 | 4.21% | 1/31/23 | 3.52% | 1/31/23 | 3.65% |
| 02/01/23 | 4.09% | 2/01/23 | 3.39% | 2/01/23 | 3.55% |
| 02/13/23 | 4.52% | 02/13/23 | 3.72% | 02/13/23 | 3.79% |
| 02/28/23 | 4.81% | 02/28/23 | 3.93% | 02/28/23 | 3.92% |
| 03/01/23 | 4.89% | 03/01/23 | 4.01% | 03/01/23 | 3.97% |
| 03/15/23 | 3.93% | 03/15/23 | 3.51% | 03/15/23 | 3.70% |
| 03/31/23 | 4.06% | 03/31/23 | 3.48% | 03/31/23 | 3.67% |
| 04/03/23 | 3.97% | 04/03/23 | 3.43% | 04/03/23 | 3.64% |
| 04/14/23 | 4.08% | 04/14/23 | 3.52% | 04/14/23 | 3.74% |
| 4/28/23 | 4.04% | 04/28/23 | 3.42% | 04/28/23 | 3.67% |
| 5/01/23 | 4.14% | 05/01/23 | 3.59% | 05/01/23 | 3.84% |
| 5/15/23 | 3.99% | 05/15/23 | 3.50% | 05/15/23 | 3.84% |
| 5/31/23 | 4.39% | 05/31/23 | 3.63% | 05/31/23 | 3.84% |
CDX Investment Grade Index May 2023

CDX Investment Grade Index May 2023
Bloomberg US Agg Corporate Avg OAS 01/01/21—5/31/23
Bloomberg Barclays US Agg Corporate Avg OAS 09/01/02—05/31/23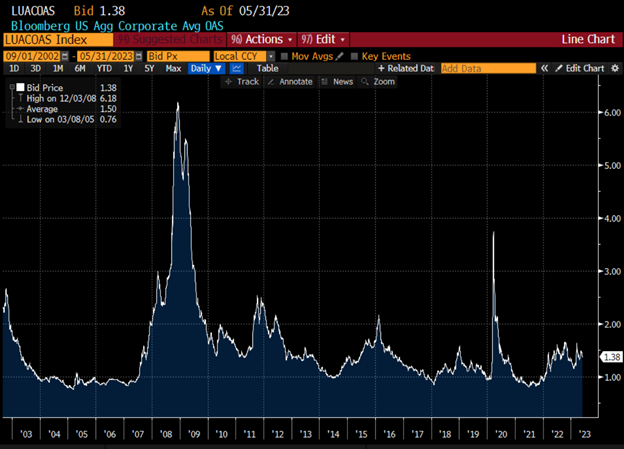
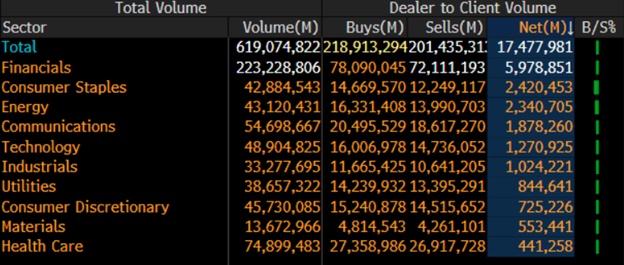
IG credit flows in May came in at $619Bln vs trailing months, April $505Bln, March $683Bln, February $617Bln, January $620Bln, December $467Bln, November $566Bln, October $574Bln, and September $576Bln. The trailing six-month average volume is $585 billion.
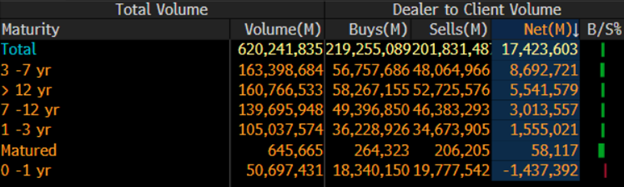
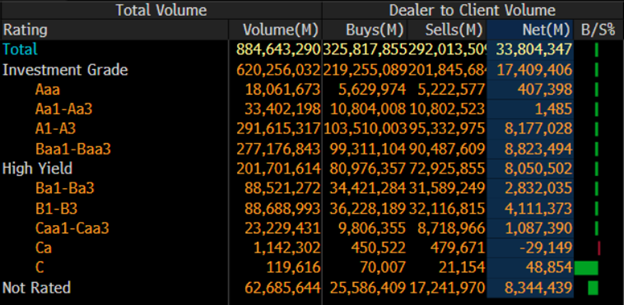
We saw a massive new issue calendar that topped expectations with mixed spreads along with massive net client selling on solid volume. May saw $17.4Bln in net client selling. The 3-7yr and 12yr and longer part of the credit curve led the selling with $8.6Bln and $5.5Bln respectively, while 0-1yr paper saw over $1.4Bln of net client buying. All sectors saw net client selling with Financials leading the charge with $5.9Bln. Looking at the markets from a ratings perspective, Baa1-Baa3 paper saw $8.8Bln of net client selling along with A1-A3 paper that saw $8.1Bln. (
See IG credit flow charts below.
May 2023 IG Credit Flows by Sector
May 2023 IG Credit Maturity Flows
May 2023 IG Credit by Investment Grade Ratings
May’s new issue calendar beat monthly expectations by 10%, while the U.S. Treasury curve saw rates move higher and a curve that remains inverted. We saw heavy secondary trading flows for the fifth month in a row, that led to massive net client selling on heightened mid-month volatility, as investors turned their attention to the debt ceiling and the upcoming Fed decision in June. The U.S. Treasury curve saw 2’s 10’s close inverted by 76 basis points and 2’s 30’s inverted by 55 basis points. The Fed was last in play May 3 and executed a 25-basis point rate hike despite the mini banking crisis and key economic data releases. The U.S. Federal Reserve has raised rates +425 basis points since March 2022. We will get the unemployment data release on Friday, June 2, along with key economic data releases before the Fed has to make their decision and hopefully a resolution to the debt ceiling that has also been weighing on the credit markets. June is expected to be on the lighter side with $80Bln expected for the month.
Great job by the AmeriVet Securities team in May, as we were a Co-Manager on $1.75Bln two-part deal for Georgia Power, $1.5Bln three-part deal for FMC Corp, $700mm 30yr for Baltimore Gas and Electric, $1.1Bln Southern California Edison two-part deal, $5Bln four-part deal for Comcast Corp and $2.75Bln 10yr for AT&T, as well as Joint Lead Manager on $3.2Bln 11NC10 for Citigroup.
The AmeriVet Securities sales team continues to bring in a large volume of differentiated orders from Tier II & Tier III accounts on new issue deals.