November Credit Snapshot


The credit markets in November saw a new issue calendar that topped expectations along with tighter spreads as a rally in U.S. Treasury rates fueled the market. Supply came in at $101.88 billion, topping expectations of $75 billion. The U.S. Treasury market saw 2’s—10’s close inverted by 70 basis points and 2’s-30’s inverted by 58 basis points at month end.
Spreads were 5 to 30 basis points tighter and traded in a 20-45 basis point range in November as lower U.S Treasury yields helped create lower funding costs. November saw heavy secondary trading activity that led to $9.4 billion in net client selling and marked the fifth straight month of net client selling (7/01/22—11/30/22 $39.8 billion net client selling).
The markets did experience some volatility, as the much-anticipated Fed meeting and 75-basis point rate hike ended up giving way to a month-long rally in the equity market, as well as a rally in credit spreads, that pushed spreads to the tightest levels since June 2022. The rally in U.S. Treasuries helped the new issue calendar and led to heavy issuance for the month.
| ISSUANCE STATS | IG (ex-SSA) Total |
| MTD | $101.88b |
| YTD | $1,176.97b |
| IG Gross (ex-SSA) | YTD |
| 2022 | $1,176.97bn (-13%) |
| 2021 | $1,349bn |
IG Credit spreads were 5 to 30 basis points tighter and traded in a big range for the month (20-45-basis points) despite a bit of a hiccup into the last 3 days of the month that saw a slight widening in spreads. The U.S. Treasury market saw 2yr notes lower by -16 basis points, 10yr notes lower by -39 basis points and the 30yr closing the month lower by -34 basis points. Looking at U.S. Treasury rates in November, we saw the month begin with 2’s — 10’s inverted at 47 basis points and 2’s — 30’s at 40 basis points, closing the month with 2’s — 10’s inverted by 70 basis points and 2’s — 30’s inverted by 58 basis points.
The Fed raised rates on 11/2/22 75-basis points and Fed Chair Powell signaled on 11/30/22 a smaller December hike amid hopes for a soft landing which was well received by investors presenting a case for achieving lower inflation without tipping the economy into a deep recession.
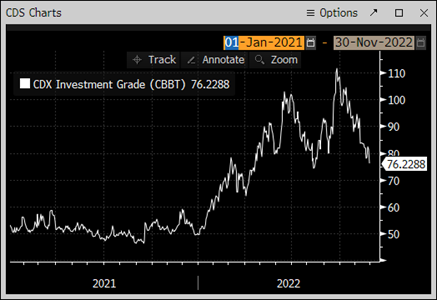
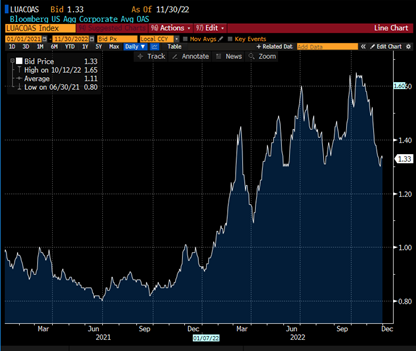
The CDX index started the month at 90.76 and traded in a tight range until 11/09/22 and then traded steadily lower into month end closing at 76.23. The Bloomberg Barclays U.S. Aggregate Average OAS opened November at 1.55 and traded in a tight range lower to 1.52 on 11/09/22, and then made its way to the lowest levels on 11/25/22 at 1.30, before closing the month slightly wider at 1.33 on 11/30/22.
See the charts below for more information.
U.S. Treasury Moves
December 31, 2021 – November 30, 2022
| 2yr U.S. Treasury | 10yr U.S. Treasury | 30yr U.S. Treasury | |||
| December 31 | 0.73% | December 31 | 1.52% | December 31 | 1.90% |
| January 3 | 0.78% | January 3 | 1.63% | January 3 | 2.01% |
| January 18 | 1.06% | January 18 | 1.87% | January 18 | 2.18% |
| January 31 | 1.18% | January 31 | 1.79% | January 31 | 2.11% |
| February 1 | 1.18% | February 1 | 1.81% | February 1 | 2.19% |
| February 15 | 1.58% | February 15 | 2.05% | February 15 | 2.37% |
| February 28 | 1.46% | February 28 | 1.86% | February 28 | 2.19% |
| March 1 | 1.31% | March 1 | 1.72% | March 1 | 2.11% |
| March 15 | 1.85% | March 15 | 2.15% | March 15 | 2.49% |
| March 31 | 2.28% | March 31 | 2.32% | March 31 | 2.44% |
| April 1 | 2.44% | April 1 | 2.40% | April 1 | 2.44% |
| April 14 | 2.47% | April 14 | 2.66% | April 14 | 2.92% |
| April 29 | 2.70% | April 29 | 2.85% | April 29 | 2.96% |
| May 2 | 2.73% | May 2 | 2.99% | May 2 | 3.07% |
| May 16 | 2.58% | May 16 | 2.88% | May 16 | 3.09% |
| May 31 | 2.53% | May 31 | 2.85% | May 31 | 3.07% |
| June 1 | 2.66% | June 1 | 2.87% | June 1 | 3.09% |
| June 15 | 3.20% | June 15 | 3.39% | June 15 | 3.39% |
| June 30 | 2.95% | June 30 | 2.97% | June 30 | 3.18% |
| July 1 | 2.84% | July 1 | 2.88% | July 1 | 3.11% |
| July 15 | 3.13% | July 15 | 2.93% | July 15 | 3.10% |
| July 29 | 2.88% | July 29 | 2.64% | July 29 | 3.01% |
| August 1 | 2.90% | August 1 | 2.60% | August 1 | 2.92% |
| August 15 | 3.20% | August 15 | 2.79% | August 15 | 3.10% |
| August 31 | 3.49% | August 31 | 3.19% | August 31 | 3.29% |
| September 1 | 3.51% | September 1 | 3.21% | September 1 | 3.37% |
| September 15 | 3.87% | September 15 | 3.46% | September 15 | 3.48% |
| September 30 | 4.22% | September 30 | 3.80% | September 30 | 3.79% |
| October 3 | 4.12% | October 3 | 3.67% | October 3 | 3.73% |
| October 14 | 4.48% | October 14 | 4.00% | October 14 | 3.99% |
| October 31 | 4.48% | October 31 | 4.04% | October 31 | 4.15% |
| November 1 | 4.54% | November 1 | 4.07% | November 1 | 4.14% |
| November 15 | 4.37% | November 15 | 3.80% | November 15 | 3.98% |
| November 30 | 4.38% | November 30 | 3.68% | November 30 | 3.80% |
CDX Investment Grade Index November 2022

CDX Investment Grade Index November 2022
Bloomberg U.S. Aggregate Corporate Average OAS
January 1, 2021 —November 30 2022
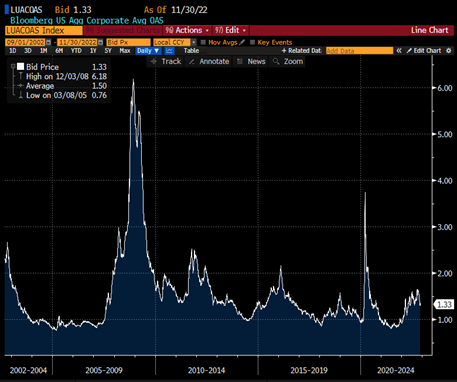
Bloomberg Barclays US Aggregate Corporate Average OAS
September 1, 2022—November 30, 2022
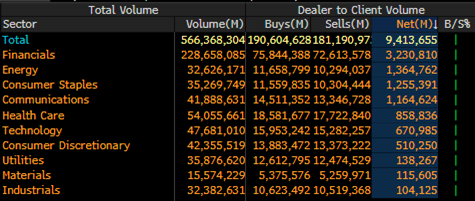
IG credit flows in the month of November came in at $566 billion vs trailing months, October $574 billion, September $576 billion, August $536 billion, July $459 billion, June $550 billion, May $549 billion, April $541 billion, March $630 billion, February $489 billion and January $483 billion. The trailing six-month average volume is $543 billion.
November saw a new issue calendar that topped expectations and tighter spreads along with another month of heavy net client selling that has the past five months net client selling at over $39.8 billion, following aggressive rate hikes by the Fed. November saw $9.4 billion in net client selling.
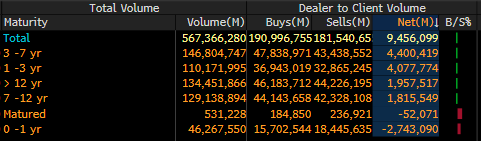
The front end of the credit curve saw the only net client buying with 0-1yr paper seeing $2.7 billion in buying. The 3-7yr and 1-3yr part of the curve dominated the selling with over $8.4 billion; 3-7yr ($4.4 billion) and 1-3yr ($4 billion). The Financial sector dominated net client selling in November with $3.2 billion, Energy $1.3 billion, Consumer Staples $1.2 billion, and Communications $1.1 billion. All sectors saw net client selling.
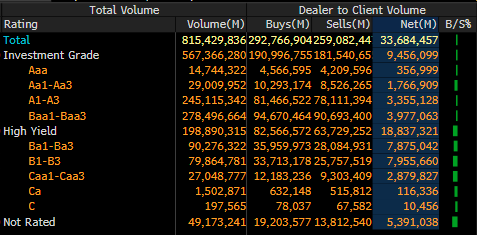
Looking at the markets from a ratings perspective Baa1/Baa3 paper saw $3.9 billion of net client selling along with A1/A3 paper seeing $3.3 billion. Aa1/Aa3 paper saw net client selling of $1.7 billion and Aaa paper saw $356 million.
See IG Credit Flow charts below for more information.
November 2022 IG Credit Flows by Sector
November 2022 IG Credit Maturity Flows
November 2022 IG Credit by Investment Grade Ratings
November’s new issue calendar heavily topped monthly expectations, while the U.S. Treasury curve rallied and further inverted with absolute yields lower, and we saw solid secondary trading flows that again lead to net client selling as spreads pushed tighter on the month. The U.S. Treasury curve saw 2’s 10’s close inverted by 70 basis points and 2’s 30’s close inverted by 58 basis points. As we look to December and the end of the year, the Fed will meet December 14 with 50-basis point rate hike anticipated after Chair Powell’s most recent speech. As we alluded to in our September credit piece, we did see some firm footing for the month of October as equity markets rallied and credit spreads pushed tighter as no Fed meeting in October allowed markets to breath and that carried over into November with lower yields, tighter spreads and a new issue calendar that topped expectations as the funding landscape improved in November.
We enter December with all eyes on the Fed’s next move, which is expected to be a slower U.S. rate hiking pace as signaled by Chair Powell, continued inflation and key economic data beginning with Friday’s Unemployment data. December new issue projections are coming in at just $20 billion a very subdued end to 2022 and would be the lowest amount in the past 3 years.
Great job by the AmeriVet Securities team in November, as we were a Co-Manager on $2 billion 6NC5 Sustainability bond for Bank of America, $2.75 billion 11NC10 for Citigroup, $2 billion 11NC10 for Credit Suisse, $1.2 billion two-part deal for Thermo Fisher, $750 million 3NC2 for Bank of NY Mellon, $1.3 billion Ford Prime Auto Loan ABS deal, $400 million 10yr 1st MTG bond for Public Service Elec and Gas and $1 billion 2yr for Bank of Nova Scotia.
The AmeriVet Securities sales team continues to bring in large volumes of differentiated orders from Tier II and Tier III accounts on new issue deals.