November Credit Snapshot


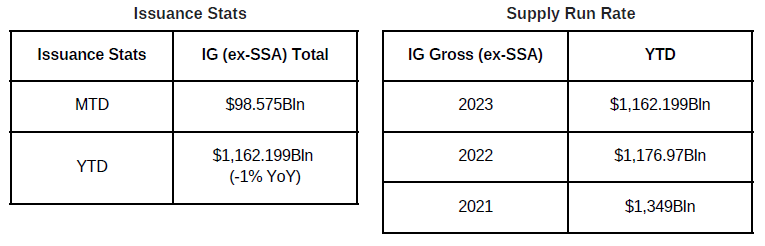
The credit markets in November topped the front end of expectations, pricing $98.575Bln on expectations of $90-100Bln. The U.S. Treasury market saw 2’s—10’s close inverted by 36 basis points while 2’s-30’s reversed and closed inverted by 19 basis point. Spreads were tighter across the board by 15 to 40 basis points and traded in a 25-45 basis point range.
November saw heavy secondary trading activity, but the real story was the second consecutive Fed “Pause” that put risk assets in overdrive pushing spreads tighter, yields lower and easing what had been a few weeks of volatility prior to the second “pause.” The month closed with $11.4Bln of net client selling, as markets reacted positively to lower U.S. Treasury yields, tighter spreads and a rally across most risk assets.
The Fed meets again December 13 and is expected to be done with rate hikes and pause again, and there is now a 48% probability of a Fed rate cut by the end of the first quarter of 2024 and a 75% chance by the end of the second quarter. The rally in spreads and U.S. Treasuries was a welcome sign for issuers, as it created a solid backdrop for new deals and lower all-in borrowing costs.
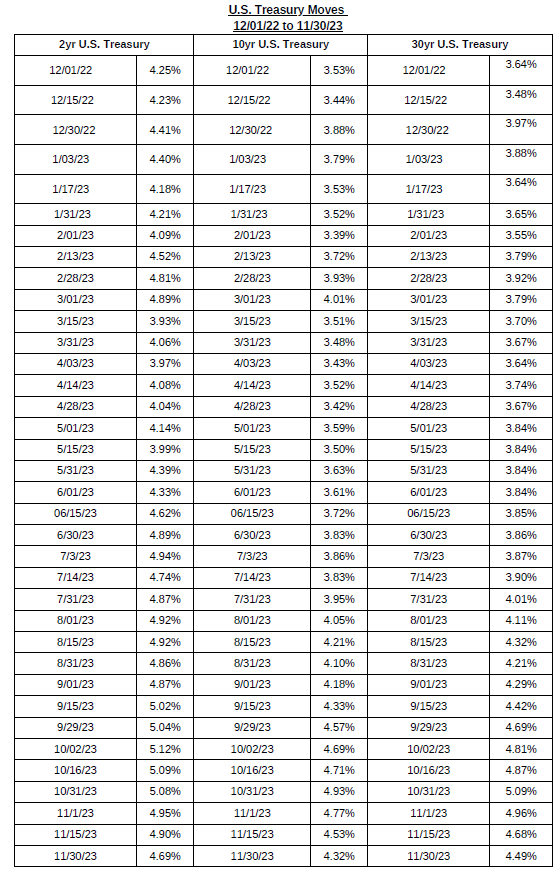
IG credit spreads were 15-40 basis points tighter, as the Fed pause fueled a credit spread rally asvolatility subsided on the month and spreads traded in a 25-40 basis point range. The U.S. Treasury market saw 2yr notes lower by -27 basis points, 10yr notes lower by -45 basis points and the 30yrclosed the month -47 basis points lower. Looking at U.S. Treasury rates in November we saw the month begin with 2’s — 10’s inverted by 18 basis points and 2’s — 30’s steep by 1 basis point, closing the month with 2’s — 10’s inverted by 36 basis points and 2’s — 30’s reversed and closed inverted by 19basis points. As we look at the markets, the Fed has raised rates 500+ basis points since March of 2022but there is light at the end of the tunnel and the markets are currently reacting positively to this news.The Fed will have plenty of unemployment data, along with key CPI and PPI reports, as they evaluate the markets into December and year-end.
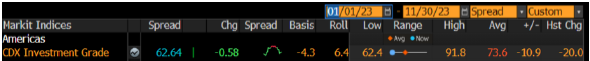
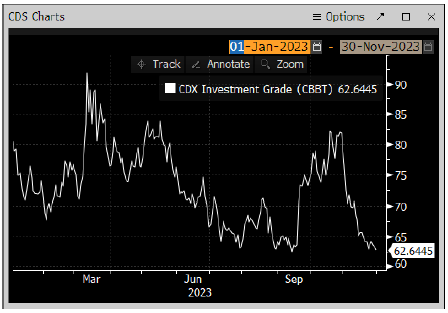
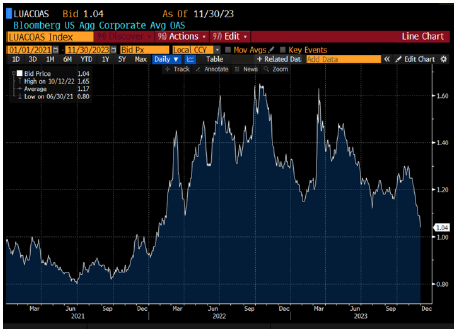
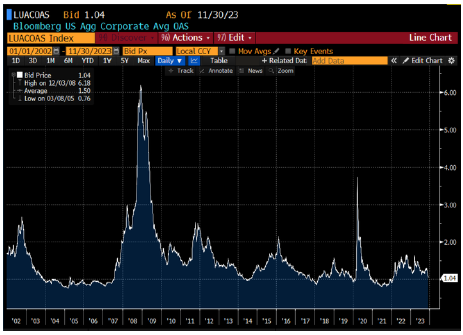
The CDX index opened November 2023 at 76.4 and traded steadily lower into mid-month hitting 65.6 on11/15/23 and pushed to month to date low of 62.64 on 11/30/23. The average spread for the month was67. It was only on 10/27/23 that the CDX index was trading at 82 basis points. The Bloomberg Barclays U.S. Aggregate Average OAS opened November 2023 at 1.29 and steadily traded lower hitting 1.18mid-month on 11/15/23 and then powered lower to close the month at the MTD and YTD low of 1.04 alevel not seen since early first quarter of 2022. The average spread for the month was +1.17.
See charts on the following page for more information.
CDX Investment Grade Index
November 2023
CDX Investment Grade Index
November 2023
Bloomberg Barclays U.S. Aggregate Corporate Average OAS
1/1/21 to 11/30/23
Bloomberg Barclays U.S. Aggregate Corporate Average OAS
1/1/02 to 11/30/23
IG credit flows in November came in at $632Bln vs trailing months, October $594Bln, September $522Bln, August $551Bln, July $517Bln, June $577Bln, May $619Bln, April $505Bln, March $683Bln, February$617Bln, January $620Bln. The trailing six-month average volume is $565Bln.
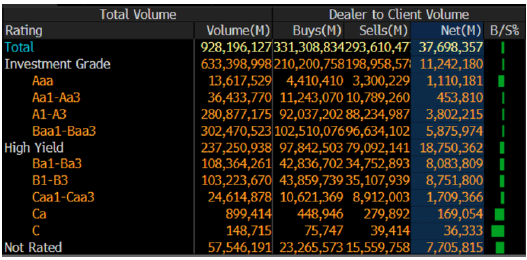
Spreads were significantly tighter, from 15-40Bps as volatility subsided and absolute yields levels came down. November saw $11.4Bln of net client selling on the move tighter in spreads and lower rates in U.S.Treasuries.
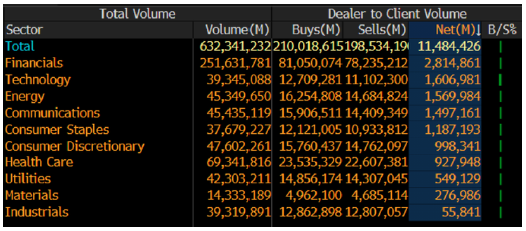
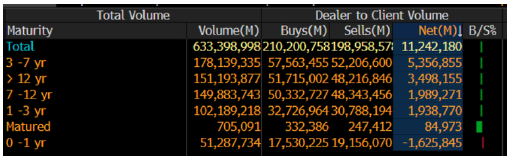
The 3-7yr, 12yr and longer, 7-12yr and 1-3yr parts of the credit curve led the selling with $12.7Bln, while 0-1yr paper saw $1.6Bln of net client buying. Financials, technology, energy and communications lead the charge in net client selling, with all sectors seeing net client selling.
Looking at the markets from a ratings perspective, Baa1/Baa3 paper saw the most net client selling, $5.8Bln,A1/A3 saw $3.8Bln while all other investment grade ratings also saw net client selling.
See IG credit flow charts on the following page for more information.
IG Credit Flows by Sector
November 2023
IG Credit Maturity Flows
November 2023
IG Credit by Investment Grade Ratings
November 2023
November’s new issue calendar saw monthly expectations met and we saw heavy secondary trading flows along with heavy net client selling into the month-end. We saw lower yields across the board in U.S.Treasuries along with tighter spreads. The U.S. Treasury curve saw 2’s 10’s close inverted by 36 basis points and 2’s 30’s reinverted by 19 basis points.
As we begin the month of December, investors are banking on another Fed rate “Pause” at the December meeting, next Friday’s unemployment data, key CPI and PPI reports and the continued war in the Middle East. Risk premiums on U. S. investment grade credit have narrowed to the tightest levels in almost two years on recent expectations that the Fed has reached the top of the Fed-tightening cycle. As further data comes out that reinforces the sentiment that the Fed tightening is done, and spreads are rallying, and yields continue to tick lower this is will present borrowers with a more favorable issuing environment. December’s new issue calendar is calling for $35Bln for the month.
Great job by the AmeriVet Securities team in November, as we were a Co-Manager on $1Bln two-part deal for Simon Property, Co-Manager on $1Bln two-part deal for Sysco, Co-Manager on $2.5Bln three-part deal for PepsiCo, $2Bln two-part deal for Toyota Motor Credit, $1.75Bln Perp for Barclays, $1.725Bln Convert for Uber Technologies, $2.5Bln three-part deal for Thermo Fischer and Junior Co-Manager on a $2.5Bln two-part deal for Citibank NA.
The AmeriVet Securities sales team continues to bring in a large volume of differentiated orders from Tier II and Tier III accounts on new issue deals.