November Credit Snapshot


In November, the credit markets saw a new issue calendar that topped monthly expectations as spreads were 5 to 25 basis points wider for the second straight month after two months of spreads tightening in August and September.
The U.S. Treasury market was flatter by 12 basis points as the omicron variant fears lead to a flattening trade into month end.
Spreads traded in a 5-35 basis point range in November as credit saw weekly volatility that pushed spreads wider. The solid new issue calendar beat estimates of $100 billion, closing the month at $111.5 billion, despite massive equity volatility that closed the new issue market for a few days, to close out the month.
Secondary activity saw net client buying of $2 billion, reversing the previous four months of net client selling.
November saw its fair share of volatility. The omicron variant, along with supply chain issues, spiking energy prices, inflation fears and the Fed continue to present a challenging environment for investors, as we look to close out the fourth quarter and year end.
| Issuance Stats | IG (ex-SSA) Total |
| MTD | $111.5 billion |
| YTD | $1,349 billion |
| Supply Run Rate | |
| IG Gross (ex-SSA) | YTD |
| 2021 | $1,349 billion |
| 2020 | $1,699.5 billion (-21%) |
| 2019 | $1,076.9 billion (+25%) |
IG credit spreads were 5 to 25 basis points wider, as spreads traded in a wide range for the month.
We began November with all eyes on the Fed, as well as the timing of tapering. Chairman Powell was endorsed to continue as Fed Chair and we are ending the month with Chairman Powell sending a strong signal toward a faster taper. We will look for the Fed to alter their pace of asset purchases beginning in January.
The market volatility has investors weighing where to put money to work on the credit curve.
The U.S. Treasury market saw some volatility in November, with the 30yr TSY trading in 14 basis point range while the 10yr traded in 11 basis point range. The 10yr closed the month 6 basis points lower and the 30yr closed 11 basis points lower.
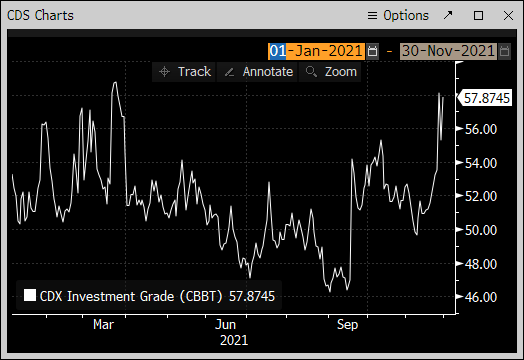
The CDX Investment Grade Index opened the month at 52.70, then traded in a tight range before moving out to the months high level of 58.1 on November 26, then trading slighter lower to close the month at 57.87. The low spread was 49.67 on November 8.
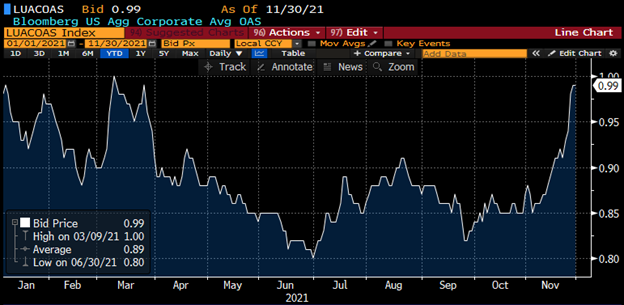
The Bloomberg Barclays U.S. Aggregate Average OAS opened November at 88 and traded a touch lower to 85 on November 3, the low of the month and steadily traded at higher levels out to the monthly high of 99 on November 30, with an average month OAS of 90.
The average high-grade corporate bond spread hit a 16-year low of 80.1 basis points back on 6/30/21 to close out the month of June.
See the charts below for more information.
Treasury Moves
January 4, 2021 – November 30, 2021
| 2yr U.S. Treasury | 10yr U.S. Treasury | 30yr U.S. Treasury | |||
| January 4 | 0.13 % | January 4 | 0.93% | January 4 | 1.65% |
| February 1 | 0.09% | February 1 | 1.09% | February 1 | 1.84% |
| March 1 | 0.17% | March 1 | 1.45% | March 1 | 2.23% |
| March 31 | 0.16% | March 31 | 1.74% | March 31 | 2.41% |
| April 1 | 0.17% | April 1 | 1.69% | April 1 | 2.34% |
| April 15 | 0.16% | April 15 | 1.56% | April 15 | 2.23% |
| April 30 | 0.16% | April 30 | 1.65% | April 30 | 2.30% |
| May 3 | 0.16% | May 3 | 1.63% | May 3 | 2.30% |
| May 17 | 0.16% | May 17 | 1.64% | May 17 | 2.36% |
| May 28 | 0.16% | May 28 | 1.58% | May 28 | 2.26% |
| June 1 | 0.14% | June 1 | 1.62% | June 1 | 2.30% |
| June 15 | 0.16% | June 15 | 1.51% | June 15 | 2.20% |
| June 30 | 0.25% | June 30 | 1.45% | June 30 | 2.06% |
| July 1 | 0.25% | July 1 | 1.48% | July 1 | 2.07% |
| July 15 | 0.23% | July 15 | 1.31% | July 15 | 1.92% |
| July 30 | 0.19% | July 30 | 1.24% | July 30 | 1.89% |
| August 2 | 0.17% | August 2 | 1.20% | August 2 | 1.86% |
| August 15 | 0.21% | August 15 | 1.26% | August 15 | 1.92% |
| August 31 | 0.20% | August 31 | 1.30% | August 31 | 1.92% |
| September 1 | 0.20% | September 1 | 1.31% | September 1 | 1.92% |
| September 15 | 0.21% | September 15 | 1.31% | September 15 | 1.87% |
| September 30 | 0.28% | September 30 | 1.52% | September 30 | 2.08% |
| October 1 | 0.27% | October 1 | 1.48% | October 1 | 2.04% |
| October 15 | 0.41% | October 15 | 1.56% | October 15 | 2.05% |
| October 29 | 0.48% | October 29 | 1.56% | October 29 | 1.93% |
| November 1 | 0.50% | November 1 | 1.58% | November 1 | 1.98% |
| November 15 | 0.53% | November 15 | 1.63% | November 15 | 2.01% |
| November 30 | 0.51% | November 30 | 1.52% | November 30 | 1.87% |
CDX Investment Grade Index
![]()
CDX Investment Grade Index
Bloomberg Barclays U.S. Aggregate Corporate Average OAS
January 1, 2020 – November 30, 2021
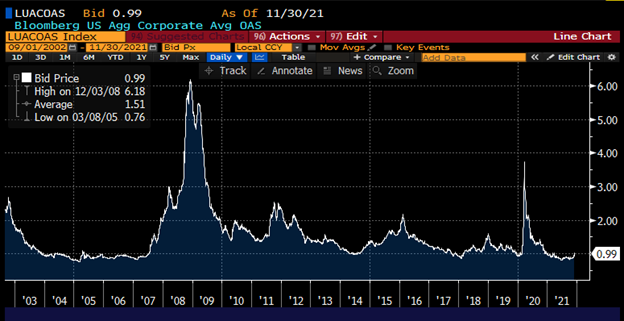
Bloomberg Barclays U.S. Aggregate Corporate Avg OAS
September 1, 2002 – November 30, 2021
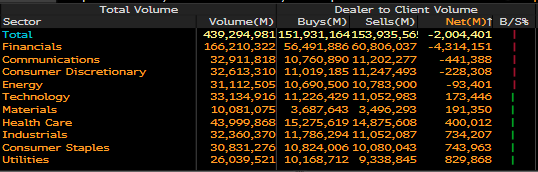
IG credit flows for the month were on the lighter side, with volatility in the market and came in at $439 billion. This is compared to $458 billion in October, $464 billion in September, $390 billion in August, $428 billion in July, $515 billion in June, $453 billion in May, $499 billion in April, $641 billion in March, $512 billion in February and $525 billion in January. The trailing six-month average volume is $449 billion.
November’s solid new issue calendar has portfolio managers buying new issues, but there continues to be a shift in secondary paper, as the undercurrents in the marketplace are causing net client selling of secondary paper across parts of the credit curve.
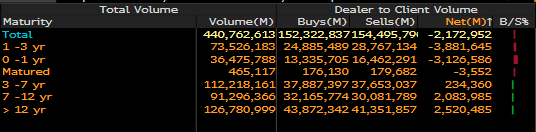
Investors sold secondary paper with 3-7yr part of the curve seeing $259 million in net client selling. 7-12yr paper saw $2 billion in net client selling, along with 12yr and greater paper seeing $2.5 billion in net client selling.
The front end of the market is seeing massive buying, with 1-3yr paper seeing $3.8 billion in net client buying and 0-1yr paper seeing $3.1 billion in net client buying.
Investors continue to favor the financial sector, as it saw over $4.3 billion in net client buying along with communications at $441 million, consumer discretionary at $228 million and energy at $93 million. The rest of the market saw net client selling, with utilities leading the charge with over $829 million in net client selling.
See the charts below for more information.
IG Credit Flows
November 2021
IG Credit Maturity Flows
November 2021
The month of November saw a new issue calendar that topped monthly expectations and lighter secondary trading flows that were caused by a strong move wider for spreads.
The U.S. Treasury curve saw a flattening yield curve, with the back end of the Treasury curve rallying again this month.
The credit markets continue to see a shift in the credit curve with net client selling in the belly and long end of the curve with the very front end seeing solid net client buying.
We are expecting $55 billion of new supply in December but will need to see some stability in the markets to get to that number, as volatility closed out the last days of November and has the Debt Capital Markets on pause.
The credit markets are beginning December with spreads trading wider and projections for the week are calling for $35 billion in new supply. This will be a difficult number to get to, without stability in the market.
Despite the volatility, the cost to sell debt remains low, as the 10-year Treasury yield has been pushed lower, while the average high-grade corporate bond spread widened to close the month at +99 over Treasuries.
The Fed will have a difficult task to try and navigate supply chain issues, worker shortages and energy prices, along with the omicron variant which has just emerged.
It is early in the process and more information will surface in the days and weeks ahead.
The primary and secondary credit markets will take their cue and react to all these undercurrents influencing the market.
Great job by the AmeriVet Securities team in November, as we were co-managers on a $3 billion 11NC10 deal for JP Morgan, $2.5 billion two-part deal for Deutsche Bank AG/New York NY, $2.1 billion two-part deal for Deutsche Bank NY, $350 million $25 par preferred for Brighthouse Financial, $1.75 billion three-part deal for Pacific Gas & Electric and $1.25 billion 11NC10 deal for Barclays PLC.
In Eurobonds, we were co-managers on a $2.8 billion three-part deal for Thermo Fischer.
The Amerivet Securities sales team continues to bring in large volumes of differentiated orders from Tier II & Tier III accounts on new issue deals.