October Credit Snapshot


In October, the credit markets saw a solid new issue calendar that beat monthly expectations, as spreads were unchanged to 15 basis points wider, reversing the previous two month’s move tighter.
Additionally, the Treasury market flattened, reversing the previous two months of steepening trade. Spreads traded in a 5-25 basis point range in October, as credit saw inter-week volatility and then a push to close the month at wider levels.
The new issue calendar topped monthly estimates of $90-$100 billion, closing October at $116.033 billion. Secondary activity saw net client selling of $404 million, following the previous three months of net client selling.
October had its fair share of issues, distracting the credit markets from a massive move in rates and equities, continued supply chain issues, spiking energy prices, worker shortages, inflation and the Fed (take your pick).
The last two months of the year will be challenging as we close out the fourth quarter and mark the end of 2021.
| Issuance Stats | IG (ex-SSA) Total |
| WTD | $19.5 billion |
| MTD | $116 billion |
| YTD | $1,237.5 billion |
IG credit spreads were unchanged to 15 basis points wider, as spreads traded in a wide range for the month.
All eyes remain on the Fed and the timing of tapering, which has investors weighing where to put money to work on the credit curve.
The Treasury market was very volatile in October and saw big moves across the curve. The 2yr note rose 21 basis points higher and in the long end, the 10yr note rose 8 basis points higher, while the 30yr Treasury was 11 basis points lower to end the month.
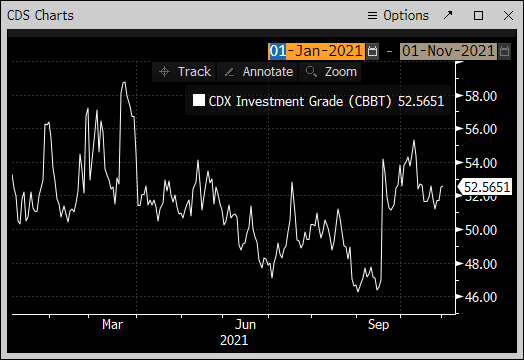
The CDX Investment Grade Index opened October at 52.585, traded to the month’s high level of 55.304 on October 12, then traded lower to the month’s tight level of 51.2 on October 26, before closing October at 52.52.
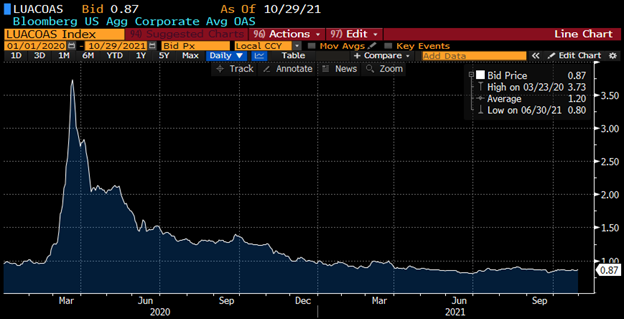
The Bloomberg Barclays U.S. Aggregate Average OAS opened October at 84, the low of the month, traded out to a monthly high of 87 on October 12 and traded in a narrow range, before closing the month at 87, with an average month OAS of 85. The average high-grade corporate bond spread hit a 16-year low of 80.1 basis points back on June 30.
See the charts below for more information.
Treasury Moves
January 4, 2021 – November 30, 2021
| 2yr U.S. Treasury | 10yr U.S. Treasury | 30yr U.S. Treasury | |||
| January 4 | 0.13 % | January 4 | 0.93% | January 4 | 1.65% |
| February 1 | 0.09% | February 1 | 1.09% | February 1 | 1.84% |
| March 1 | 0.17% | March 1 | 1.45% | March 1 | 2.23% |
| March 31 | 0.16% | March 31 | 1.74% | March 31 | 2.41% |
| April 1 | 0.17% | April 1 | 1.69% | April 1 | 2.34% |
| April 15 | 0.16% | April 15 | 1.56% | April 15 | 2.23% |
| April 30 | 0.16% | April 30 | 1.65% | April 30 | 2.30% |
| May 3 | 0.16% | May 3 | 1.63% | May 3 | 2.30% |
| May 17 | 0.16% | May 17 | 1.64% | May 17 | 2.36% |
| May 28 | 0.16% | May 28 | 1.58% | May 28 | 2.26% |
| June 1 | 0.14% | June 1 | 1.62% | June 1 | 2.30% |
| June 15 | 0.16% | June 15 | 1.51% | June 15 | 2.20% |
| June 30 | 0.25% | June 30 | 1.45% | June 30 | 2.06% |
| July 1 | 0.25% | July 1 | 1.48% | July 1 | 2.07% |
| July 15 | 0.23% | July 15 | 1.31% | July 15 | 1.92% |
| July 30 | 0.19% | July 30 | 1.24% | July 30 | 1.89% |
| August 2 | 0.17% | August 2 | 1.20% | August 2 | 1.86% |
| August 15 | 0.21% | August 15 | 1.26% | August 15 | 1.92% |
| August 31 | 0.20% | August 31 | 1.30% | August 31 | 1.92% |
| September 1 | 0.20% | September 1 | 1.31% | September 1 | 1.92% |
| September 15 | 0.21% | September 15 | 1.31% | September 15 | 1.87% |
| September 30 | 0.28% | September 30 | 1.52% | September 30 | 2.08% |
| October 1 | 0.27% | October 1 | 1.48% | October 1 | 2.04% |
| October 15 | 0.41% | October 15 | 1.56% | October 15 | 2.05% |
| October 29 | 0.48% | October 29 | 1.56% | October 29 | 1.93% |
CDX Investment Grade Index
![]() CDX Investment Grade Index
CDX Investment Grade Index
Bloomberg Barclays U.S. Aggregate Corporate Average OAS
January 1, 2020 – November 30, 2021
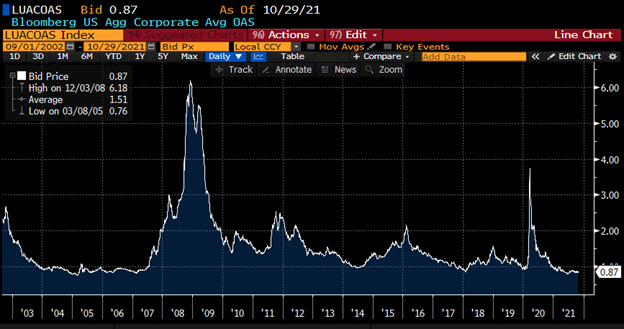
Bloomberg Barclays U.S. Aggregate Corporate Avg OAS
September 1, 2002 – November 30, 2021
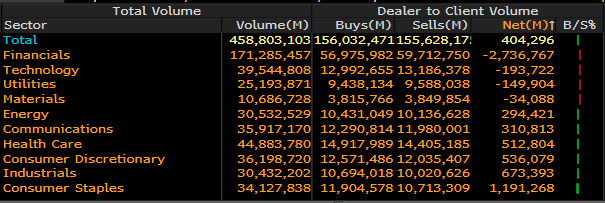
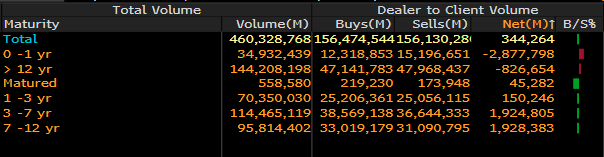
IG credit flows were solid again this month, coming in at $458 billion. This is compared to $464 billion in September, $390 billion in August, $428 billion in July, $515 billion in June, $453 billion in May, $499 billion in April, $641 billion in March, $512 billion in February and $525 billion in January. The trailing six-month average volume is $451 billion.
October had a solid new issue calendar that continued to see portfolio managers buying new issues, but there was a bit of a shift in secondary paper this month, as the undercurrents in the marketplace caused some net client selling of secondary paper across the credit curve.
Investors moved paper across the credit curve, as we saw over $2.8 billion in net client buying in 0-1yr paper and $826 million 12-30yr maturities.
On the flipside, we saw net client selling of over $1.9 billion in 7-12yr, $1.89 billion in 3-7yr paper and $150 million in 1-3yr maturities.
Investors continue to favor the financial sector, as it saw over $2.7 billion in net client buying, along with technology at $193 million, utilities at $149 million and materials at $34 million. The rest of the market saw net client selling and consumer staples led the charge, with over $1.1 billion in net client selling.
See the charts below for more information.
IG Credit Flows
October 2021
IG Credit Maturity Flows
September 2021
This month, we saw a new issue calendar that topped monthly expectations, solid secondary trading flows, but a move wider for spreads to close out October.
The Treasury curve saw a rise in rates and a flatter yield curve, with the back end of the Treasury curve rallying.
The credit market saw a shift in the credit curve, with net client selling in the belly of the curve, and the very front-end and back-end of the markets seeing net client buying.
We expect $100 billion of new supply in November and the credit markets are beginning the month with spreads a bit wider. Projections for the first week in November are calling for $25 billion in new supply.
In addition, we anticipate that the new issue calendar will be front-loaded, as investment-grade borrowers will likely try to get ahead of the Federal Reserve’s expected tapering announcement on Wednesday, November 3.
Interest rates are rising in anticipation that the central bank (which is widely expected to outline plans for tapering its asset purchases) might need to accelerate the process of policy tightening, in order to combat inflation risks.
The Fed will try and navigate supply chain issues, worker shortages and energy prices. The primary and secondary credit markets will react to all these undercurrents, which are influencing the market.
Great job by the AmeriVet Securities team in October, as we were joint lead managers on a $2.5 billion 4NC3 tranche for Morgan Stanley and a $1.75 billion 11NC10 tranche for Citigroup.
In addition, we were co-managers on a $1.3 billion $25 par preferred for Bank of America, a $1.5 billion three-part deal for Bank of NY and a $5.85 billion five-part deal for Thermo Fischer. In Euro Bonds, we were co-managers on a $5.25 billion four-part deal for Thermo Fischer.
The AmeriVet Securities sales team continues to bring in large volumes of differentiated orders from Tier II and Tier III accounts on new issue deals.