September Credit Snapshot


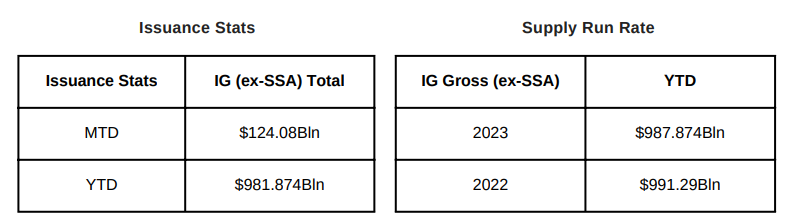
The credit markets in September topped monthly expectations and came in at $124.08Bln beating expectations of $120Bln. September 2023 rebounded from September 2022’s issuance that saw just$78Bln.
The U.S. Treasury market saw 2’s—10’s and 2’s-30’s close less inverted in September. Spreads were unchanged to 20 basis points wider and traded in a 10-35 basis point range. September saw solid secondary trading activity as markets digested a “pause” from the Fed and a signaling of higher for longer and one potential hike remaining. On the month, we saw decent net client selling with September coming in at $6.3Bln on wider spreads and higher absolute yields.
The markets now look to the fourth quarter, a UAW strike, third quarter earnings kick-off and potentially another Fed rate hike November 1
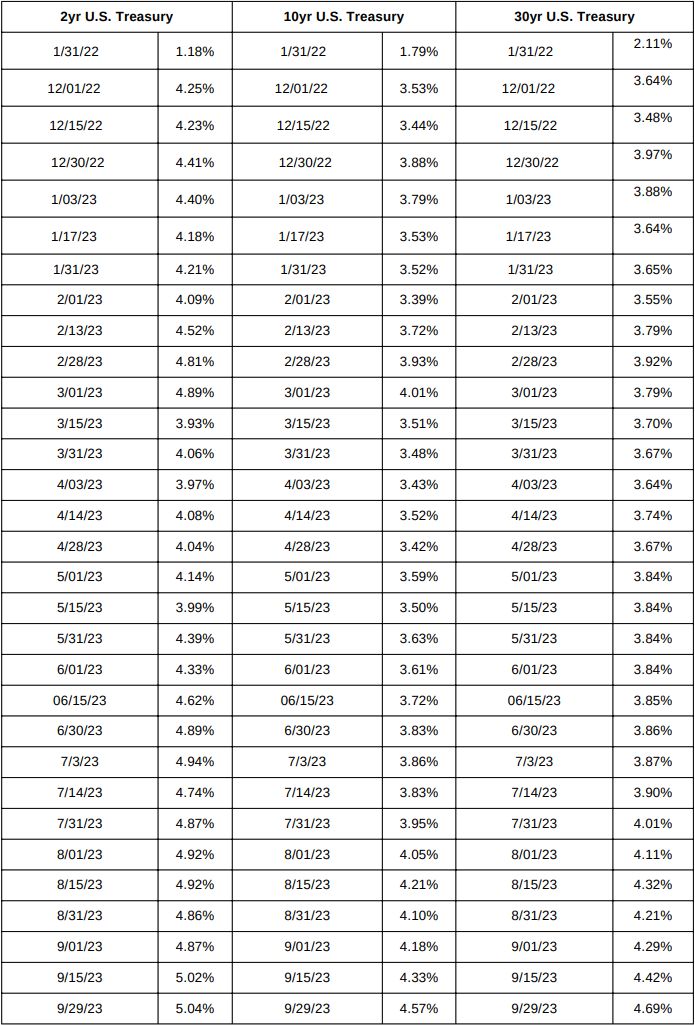
IIG credit spreads in September were unchanged to 20 basis points wider and traded in a 10-35 basis point range on the month, and now the YTD lows for spreads seen in July seem like a memory. The U.S. Treasury market saw 2yr notes higher by +17 basis points, 10yr notes higher by +39 basis points and the 30yr closed the month +40 basis points higher. Looking at U.S. Treasury rates in September we saw the month begin with 2’s — 10’s inverted by 69 basis points and 2’s — 30’s by 58 basis points, closing the month with 2’s — 10’s inverted by 47 basis points and 2’s — 30’s inverted by 35 basis points. The Fed paused in September but has still raised rates 500+ basis points since March of 2022 and have signaled another potential rate hike before year end along with higher for longer on rates.
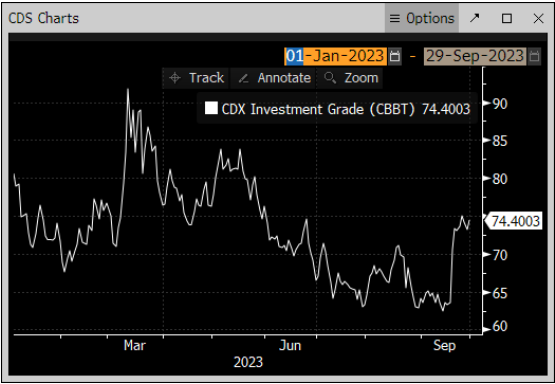
The Fed will have unemployment data, along with key CPI and PPI reports, and third quarter earnings slated for mid-month October prior to their next meeting scheduled for November 1. The CDX index opened September 2023 at 63.5 and traded in a tight range until mid-month and traded at the YTD low 62.4 on 9/14/23.
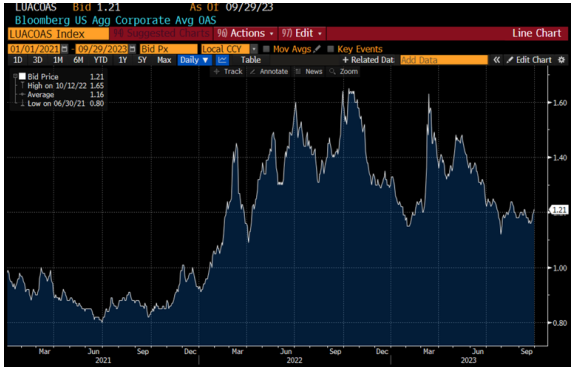
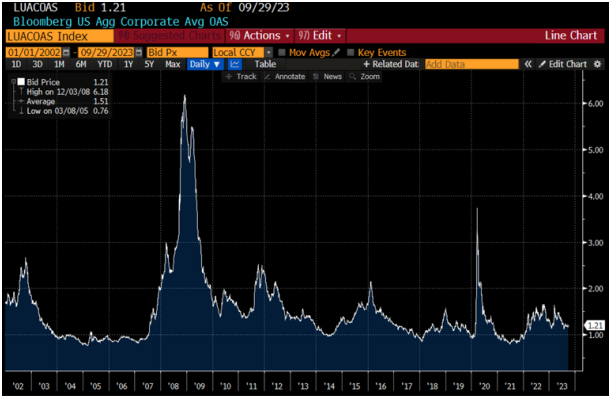
As mid-month rolled on, the index traded higher to 73.3 on 9/21/23 and moved to the month’s high of 75 on 9/26/23, before closing at 74.40 on 9/29/23. The Bloomberg Barclays U.S. Aggregate Average OAS opened September 23’ at 1.19 and traded to the months high of 1.21 on 9/12/23 and 9/13/23. The index pushed lower into mid-month and at 1.18 on 9/15/23 and traded to a month low of 1.16 on 9/20/23, before again pushing higher to end the month at 1.21 on 9/29/23. The average spread for the month was +1.19.
See charts for more information.
U.S. Treasury Moves
1/31/22 to 9/29/23
CDX Investment Grade Index
September 2023

CDX Investment Grade Index
September 2023
Bloomberg Barclays U.S. Aggregate Corporate Average OAS
1/1/21 to 9/29/23
Bloomberg Barclays U.S. Aggregate Corporate Average OAS
1/1/02 to 9/29/23
IG credit flows in September came in at $522Bln vs trailing months, August $551Bln, July $517Bln, June $577Bln, May $619Bln, April $505Bln, March $683Bln, February $617Bln, January $620Bln. The trailing six-month average volume is $548billion. Spreads moved wider in September along with August and we saw steady net client selling as the new issue calendar topped expectations, despite higher U.S. Treasury yields.
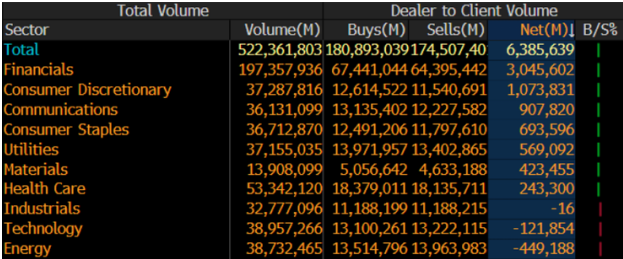
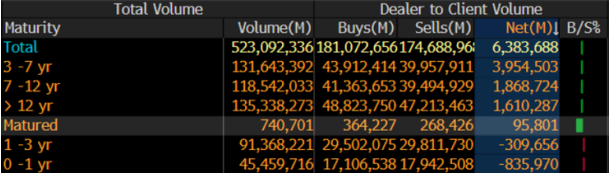
September saw $6.3Bln of net client selling which was on pace with the steady stream of selling we saw in July and May. The 3-7yr, 7-12yr and 12yr and longer parts of the credit curve led the selling, while 0-1yr and 1-3yr paper saw over $1.1Bln of net client buying, respectively. Financials, Consumer Discretionary, Communications, Consumer Staples and Utilities lead the charge in net client selling while Energy, Technology and Industrials saw light net client buying.
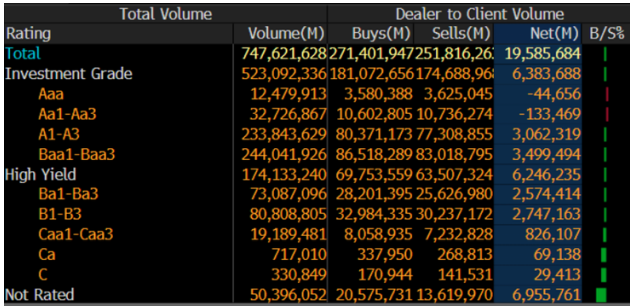
Looking at the markets from a ratings perspective, Baa1/Baa3 and A1/A3 paper saw net client selling of $6.4Bln with all other investment grade ratings saw light net client buying.
See IG credit flow charts for more information.
IG Credit Flows by Sector
September 2023
IG Credit Maturity Flows
September 2023
IG Credit by Investment Grade Ratings
September 2023
September’s new issue calendar topped monthly expectations and we saw solid secondary trading flows 7 along with heavy net client selling. We saw a solid move higher for the long end of U.S. Treasury yields along with wider credit spreads. The U.S. Treasury curve saw 2’s 10’s close inverted by 47 basis points and 2’s 30’s inverted by 35 basis points.
As we begin the month of October, investors turn their attention to Unemployment data, key CPI and PPI reports and upcoming earnings reports. The Fed will meet on November 1 and will evaluate a potential last rate hike but clearly their rate tightening is helping to bring down inflation. However, the effects of a zero-interest rate policy and free money over a 15-year period, followed by a rapid rate hike environment are clearly weighing on the U.S. consumer and the economy.
October’s new issue calendar is expected to be on the lighter side, with $85Bln expected for the month with the second half of the month expected to be busier as companies exit earnings blackouts. For the first week of October, expectations are calling for $15-20Bln of new bonds, with Yankee issuers expected to account for most new deals as many US companies will be in earnings blackout periods.
Great job by the AmeriVet Securities team in September, as we were a Co-Manager on $2Bln two-part deal for Sumitomo Mitsui Financial Group, Co-Manager on $700mm 10yr for Southern Co, Co-Lead Manager on $3Bln three-part deal for UBS AG through the London Branch, Co-Manager on $1.5Bln 11NC10 for Barclays PLC, Co-Manager on $1.05Bln Verizon Asset Backed deal, Co-Manager on $1.5Bln 7.625% Perp for Citigroup, and Co-Lead Manager on $4.5Bln three-part deal for UBS Group AG.
The AmeriVet Securities sales team continues to bring in a large volume of differentiated orders from Tier II and Tier III accounts on new issue deals.