Liquid Natural Gas & The Biden Administration


Executive summary
- Global demand for liquefied natural gas (LNG) is estimated to rise over 50% by 2040
- The Biden Administration’s decision to pause new LNG export terminal projects is a complex issue with many economic, environmental, and political considerations.
- These projects, if approved, could double America’s LNG export capacity.
- Technologies to capture emissions or modify engine operation to reduce emissions have been examined for many years but are not mandatory.
US Government Actions
On January 26th, the Biden Administration announced a temporary pause on pending decisions for new facilities to export Liquefied Natural Gas (LNG) so the Department of Energy (DOE) can update their underlying analyses. The decision is complex with intertwined economic, environmental, and political considerations. DOE authorizations and Federal Energy Regulatory Commission (FERC) permits for siting and construction of LNG export facilities are the two approvals necessary for major export projects. Under the Natural Gas Act, DOE is required to approve authorizations unless doing so would not be in the public interest. The administration will reassess how DOE conducts these public interest reviews, especially to account for climate concerns, domestic energy costs, and U.S. energy security.[1] This will directly affect European and other natural gas consumers.
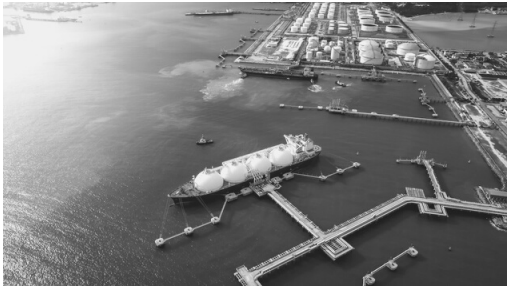
The U.S. has seven operational LNG terminals, mainly located in Louisiana and Texas. With DOE approval up to five more will become operational in the coming years. President Biden’s action does not impact existing projects. However, it will delay pending or planned LNG projects, such as the $10B Calcasieu Pass 2 project along Louisiana’s Gulf Coast.[2] This project, if completed, would be the largest export terminal in the US. Although much cleaner than coal, LNG processing, shipment and use also contribute to greenhouse emissions, particularly Methane.
History and Economics
Around 1785, the British first used natural gas to light houses and streets. In 1816, Baltimore, Maryland used natural gas to become the first city in the United States to light its streets with gas. In 1938, the US government began regulating the natural gas industry with passage of the Natural Gas Act, intended to protect consumers from possible abuses such as unreasonably high prices. The Act gave the Federal Power Commission (FPC) jurisdiction to regulate transportation (including certifying new interstate pipelines) and sale of natural gas in interstate commerce.[3]
The Department of Energy Organization Act of 1977 transferred most FPC interstate regulatory functions to a five-member Federal Energy Regulatory Commission (FERC). The FERC controls the electric power and natural gas industries, including setting rates and charges for transportation and sale/resale of natural gas in interstate commerce. The Act also transferred the authority to set oil pipeline transportation rates and to set the value of oil pipelines for ratemaking purposes to the FERC from the Interstate Commerce Commission. Of note, the FERC is independent of the administration but works in cooperation with DOE.
Europe
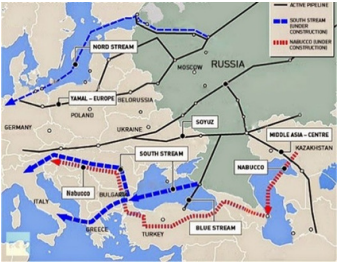
In 1965 natural gas accounted for less than 8% of energy consumption in the EU. By 2018, that rose to ~15% while Nuclear and Renewable energy also increased. Fossil fuel use decreased from around 90% in 1965 to about 41% of energy consumption in 2022.[4] The reduction in natural gas is a recent phenomenon, driven by distrust of Russian control over the supply of gas through their extensive pipeline network. In 2021, Russia supplied 155 billion cubic meters (bcm) of natural gas to the EU. That was reduced to only 45 bcm in 2023 because of the gas crisis emerging from Russia’s invasion of Ukraine.
Although the US has increased exports to Europe to help reduce their dependence on Russian natural gas, the Europeans also have doubled down on their renewable sector’s production of energy.[5]
Global demand for liquefied natural gas (LNG) is estimated to rise by 50%+ by 2040, as China and countries in South and Southeast Asia use LNG to support their economic growth.[6] US LNG exports have surged by 135% since 2019 (Russia invaded Ukraine on 24 February 2022), and as the world’s largest LNG exporter, the US delivers to 36 countries. If the new facilities go forward, the US will remain the largest source of LNG in the future.
Europe’s imports have risen from an average of 72 million tons per year (2019-2021) to 113 million in 2022 and 2023.[7] This rise occurred despite changes in Russian delivery systems (owned by Gazprom) and supply of LNG to the EU. From the time Nordstream-1 (NS1) came online in 2006 there have been challenges by EU states on the use of NS1, which also affects the potential use of NS2. Ukraine is a member of the 2012 Energy Community Treaty, which has adopted EU rules on energy markets and infrastructure regulation. However, Russia decided to circumvent Ukraine and other eastern European nations with NS2. This puts supply demands on states that cannot be negotiated because the Russian Federation has consistently refused to enter a serious dialogue on the legal status of its export pipelines. As these factors continued to fester in Europe, U.S. LNG exports have doubled over the last four years. If approved, these projects could double America’s LNG export capacity in the coming years. In the short term, increasing export capacity will increase costs for US consumers; but in the longer term some analysts believe the laws of supply and demand will win out.
The Science
Several pollutants need to be understood when discussing LNG vice other energy sources. Methane is a principle component of natural gas. It persists for between 8 and 12 years until dissipated by tropical hydroxyl, which releases water and carbon dioxide. CO2 is more persistent, lingering for hundreds of years or until plants consume it and release oxygen. Black carbon only stays in the atmosphere for days or weeks, but when it falls to the surface at the poles, it can trap heat and contribute to melting of the snowpack (believed to be tied to ocean levels rising). Nitrogen oxide and Nitrogen dioxide (NOx) depletes the ozone layer which contributes to global warming. NOx has 300 times the warming potential of carbon dioxide (CO₂) and stays in the atmosphere for an average of 116 years.
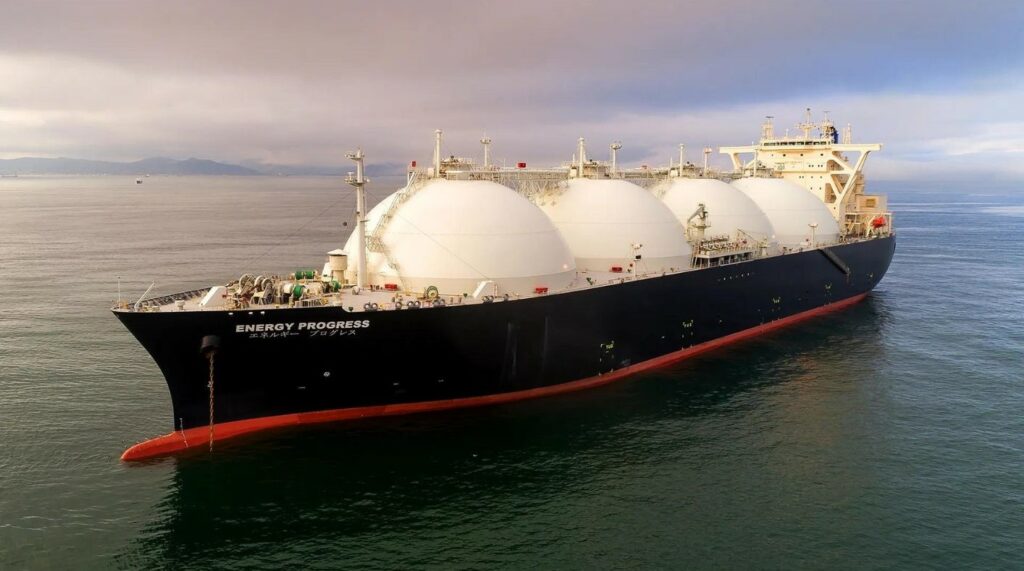
LNG is created by transforming natural gas into a liquid state by cooling it to -161C (-259F). The process reduces it to 1/600th of its original unliquified volume and half the weight of water. LNG is typically 85-95% methane.
Pollutants escape into the atmosphere throughout the fuel cycle. From extraction, processing, transport (the main discussion item for LNG), re-processing into useable fuel, distribution and finally burning the process is subject to emissions of greenhouse gasses.
Compared to Diesel, LNG is better on the environment. That is not to imply LNG has no emissions, but specific emissions are the Administration’s rationale for suspension of new LNG facilities. One factor is ships using LNG as fuel when it is moved from the US. Ship engines built for diesel can burn LNG, but not efficiently, especially at low power settings. A number of studies of existing shipping engines and some prototype testing of new techniques for capturing and disposing/burning harmful emissions have been conducted in the past few years. In short, LNG as a fuel for shipping is around 20% lower in CO2 emissions than diesel fuel. However, much more methane is released at low power settings, offsetting CO2 benefits.
Technologies to capture emissions or to modify engine operation to reduce emissions have been investigted by both sides in the discussion. Alternatives such as injecting harmful gases into the ground have been discussed by some industry leaders, but there are no current incentives for industry to modify their approach to the supply and distribution chains to reduce emissions into the atmosphere.[10]
Possible Way Forward
The review by DOE may result in changes to requirements for supply and distribution chains in the US. Some changes could be moderately affordable, such as requiring ships at harbor to use on-shore power instead of burning fuel (diesel or LNG) at low power settings. This is not possible at some existing facilities; but if made a requirement for new facilities it would add expense to the projects without any significant monetary benefits… essentially eating into profits and requiring higher capital investments. Other financial incentives will be necessary.
Requiring or incentivizing shipping companies to install new technologies for capture and re-burning of emissions may also be possible. In the longer term, requirements for engines to be cleaner, such as the EPA has done for autos in the US, would force shippers to either install new technologies as those become available or lose out on the US export market. Costs for these requirements have not been estimated but would likely be passed to customers.
Any changes will require the Administration and Congress to agree on policy, as well as the achievability of that policy in any selected time frame. In the short term, when compared to coal and other fossil fuels, LNG offers a reduction in overall pollution for nations either trying to avoid political pressure from Russia or moving from a more climate unfriendly economy to a net-zero emissions standard. China, for example, has seen a rapid increase in LNG imports since 2006 (see chart).[11]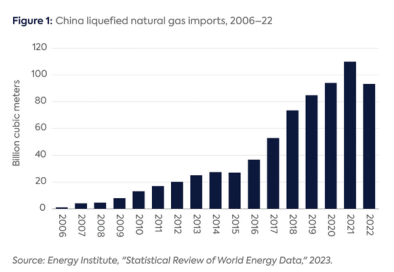
This constitutes a unique situation for the US vis-à-vis China; putting the US in a position of leverage over the Chinese energy industry, at least for the short term. What we do with that leverage is yet to be determined.
Over the past 15 years, the U.S. has experienced the largest decline in carbon dioxide equivalent emissions of any country. This includes CO2 equivalent emissions from energy processing, methane, and flaring (burning off excess gas).
The single biggest reason for this decline was natural gas displacing coal in power production. In 2007, coal was over 40% of all power production, while natural gas held only 20%. By 2022, coal had significantly been displaced by natural gas. Coal’s share had fallen to 20%, and the natural gas share had increased to 40%.[12]
In the next few months DOE will review the data and make recommendations. How the DOE includes the Congress, and how Congress and various political candidates use the issue for leverage in November will outline what paths are achievable in the future. Most alternatives are long term solutions such as modifying ship engines to reduce emissions and tightening controls and criteria for the supply chain. Environmentalists, however, will likely not be satisfied until all fossil fuels are eliminated.

Learn more about the author, Advisory Board member and retired U.S. Air Force Major General Michael Snodgrass.
[1] See: https://www.csis.org/analysis/biden-administration-pauses-new-lng-approvals
[3] See: https://www.apga.org/apgamainsite/aboutus/facts/history-of-natural-gas
[4] Compiled from: https://greendealflow.com/europe-shifted-600-twh-electricity-generation-by-source-to-green-power-in-10-years/ and https://efaidnbmnnnibpcajpcglclefindmkaj/https://institutdelors.eu/wp-content/uploads/2019/12/PP247_Russianpipeline_JDEC-JAV_EN.pdf
[5] See: https://ec.europa.eu/commission/presscorner/detail/en/fs_23_5189
[7] See; https://www.ief.org/focus/ief-reports/fragile-equilibrium-lng-trade-dynamics-and-market-risks
[8] See: https://institutdelors.eu/wp-content/uploads/2019/12/PP247_Russianpipeline_JDEC-JAV_EN.pdf
[9] See: https://www.washingtonpost.com/climate-environment/2023/10/17/natural-gas-exports-climate-activists/
[10] Several studies are available for more in depth review: https://www.highnorthnews.com/en/new-lifecycle-assessment-greenhouse-gases-lng-spells-bad-news-emissions-arctic-projects , https://www.nstauthority.co.uk/the-move-to-net-zero/net-zero-benchmarking-and-analysis/natural-gas-carbon-footprint-analysis/ , https://efaidnbmnnnibpcajpcglclefindmkaj/https://www.maritime.dot.gov/sites/marad.dot.gov/files/docs/innovation/meta/11836/modal-emissions.pdf , http://research.policyarchive.org/19859.pdf
[11] See: https://www.energypolicy.columbia.edu/inside-chinas-2023-natural-gas-development-report/
[12] https://www.energyinst.org/statistical-review